Are you staring at charts, feeling lost about whether your investments are actually performing well? You've bought some stocks, maybe a mutual fund or ETF, added a bit of crypto, perhaps a piece of real estate – and now you're wondering, "Am I really making money?"
While investing is the first step, observing and understanding your results is what separates successful investors from those who just hope for the best. But you don't need a finance degree or expensive investment advice to manage that.
This guide shows you how to track all your investments in one place – across brokers, currencies and asset types. By the end, you'll know how to monitor stocks, ETFs, bonds, crypto, real estate, employee share plans, private investments and other assets in a way that matches your strategy. Whether you're a long-term investor checking twice a year or someone who prefers more frequent updates, the goal is staying informed without spending too much time on it.
Table of Contents
- TL;DR
- Ignoring Tracking Your Investment Portfolio Costs You Money!
- Beyond Stock Prices: Different Types of Data That Actually Matters
- Category 1: Performance metrics
- Category 2: Asset allocation
- Category 3: Dividends and income
- Category 4: Fees and expenses
- Category 5: Tax implications & tax-lot tracking
- Common Mistakes in Investment Tracking
- Mistake 1: The Price-Only Trap
- Mistake 2: The Daily Checking Obsession
- Mistake 3: The Forgotten Dividends Error
- Mistake 4: The Total Neglect Risk
- Essential Metrics for Portfolio Performance
- Total Return – The Absolute Must-Know Metric
- Secret Power of Money-Weighted Return (MWR)
- Time-Weighted Return (TWR) – Judging Strategy, Not Cash Flow
- Compare Your Strategy with the Right Benchmark
- Understand Volatility – The Key to Staying Calm With Investments
- How to Track All Investments in One Place? Ways to Monitor Investments and Track Your Portfolio
- Traditional Excel Spreadsheet
- Take a Glimpse on Digital Portfolio Trackers!
- Tier 1 – Brokerage and bank platforms (a.k.a. single-broker dashboards)
- Tier 2 – Stock-tracking apps (real-time prices, news and watchlists)
- Tier 3 – Automated aggregators (Plaid- or Yodlee-backed)
- Tier 4 – High-fidelity, privacy-first platforms (manual or import-based)
- From Just Tracking to Managing: A Smarter Way to Track Your Net Worth
- 1. Specific Goal
- 2. Strategy
- 3. Execution
- 4. Optimization
- Ready to Choose Your Investment Portfolio Tracker?
- Frequently Asked Questions
TL;DR
- Five things that matter: performance, asset allocation, dividends/income, fees and taxes, including tax-lot tracking where your country allows it.
- Three numbers to compute: Total Return for the headline result, MWR or IRR for your personal money-weighted return, TWR to judge your strategy versus a benchmark.
- Four tool categories, simplest to most powerful: broker/bank dashboards → stock-tracking apps → automated aggregators (Plaid/Yodlee-style) → high-fidelity platforms (manual or import-based, multi-currency, privacy-first).
- Pick which: single broker, simple holdings → broker dashboard. Multiple brokers, multiple currencies, custom assets (real estate, employee share plans, stock options, private equity), or you'd rather not authorize a third-party aggregator → high-fidelity platform.
Ignoring Tracking Your Investment Portfolio Costs You Money!
Some people think that tracking your portfolio is about watching numbers fluctuate. But the truth is it's much more about strategically balancing your asset allocation to align with your financial goals.
Sounds complicated? For the beginning, think about it as your financial GPS - it's not just about knowing what you own, but using an investment tracker to understand if you're actually moving in the right way. Without measuring, you're essentially driving blindfolded, hoping you're heading in the right direction.

Fortunately following your portfolio effectively doesn't require you to become a spreadsheet wizard or spend hours crunching numbers. It all comes down to watching a few key elements...
Beyond Stock Prices: Different Types of Data That Actually Matters
Let's break down the five key categories of data that matter most for your investment measuring. Think of these components as vital signs for your financial health - they tell you if your approach is thriving or needs some attention:
Category 1: Performance metrics
Outcome metrics reveal the ultimate truth about your investments - beyond the simple ups and downs you see in your brokerage app. These numbers cut through the noise to show if your $1,000 investment from last year really grew into $1,100, or if inflation ate away those gains, leaving you with less purchasing power than when you started. They're the difference between feeling good about a 10% return and realizing that the market overall grew by 15% during the same period.
In the next section Essential Portfolio Metrics you will find out which metrics actually matter the most.
Category 2: Asset allocation
It’s fancy-speak for "what you own and how much of each thing."
Asset allocation simply means understanding what percentage of your money goes into different types of investments. Some of your wealth might be in:
- stocks for growth potential,
- bonds for stability
- real estate usually the biggest part of most portfolios. While many see their home just as a place to live, treating it as an investment has advantages:
- Property often grows in value over time
- Mortgage payments build equity
- Property can protect against inflation
- Tax benefits in many countries
- If you have more properties, you can earn rental income (and easily monitor it as part of your wealth).
- gold, crypto or other investments to diversify further
Getting this mixture right matters because it directly impacts how much your portfolio could grow and how much risk you're taking on. While a stock-heavy portfolio might offer better growth potential, it also means dealing with bigger market swings along the way.
Category 3: Dividends and income
If you dream of passive income, earning money for you even when you sleep, this metric will be crucial for you.
Dividends are like your portfolio's paycheck. Many investors set up a DRIP (Dividend Reinvestment Plan) so each payout is automatically reinvested into more shares. A tracker should record those reinvestments as new lots, not just as invisible price growth. Understanding your dividend income - how much you receive, how often it comes in, and whether it's growing over time - gives you concrete insight into your portfolio's income-generating potential. This becomes particularly valuable whether you want to achieve financial independence or create a steady income stream from your investments.
Category 4: Fees and expenses
Fees are the silent money-drainers of your portfolio. Even small percentages can significantly impact your returns over time. Consider this: a 1% annual fee on a $10,000 investment means $100 lost in the first year, but over 20 years - assuming a 7% market return - those fees would cost you over $6,600 in total returns. That's 17% of your potential wealth gone to fees! The SEC's investor bulletin on how fees and expenses affect your portfolio shows the same compounding maths on a $100,000 portfolio.
If you invest across borders, also watch the FX (currency conversion) spread your broker charges every time it converts cash. A 0.5–1% FX fee on each buy and sell quietly compounds the same way as platform fees. A multi-currency tracker should separate asset return from currency return, so you can see whether a gain came from the investment itself or from the exchange rate.
Category 5: Tax implications & tax-lot tracking
Finally, there's the tax piece of the puzzle - where good records can save you serious money and make year-end reporting less painful. Each country has its own capital-gains rules. Some require FIFO, some allow average cost, and some allow specific-lot identification if you keep the right records. The IRS discusses US cost-basis rules in Publication 550, Investment Income and Expenses. A tracker that records tax lots individually gives you the evidence needed for whichever method applies to your account and country.
For example, in a US taxable account, selling an investment after 11 months versus waiting one more month for the one-year mark can mean paying short-term ordinary-income rates instead of long-term capital gains rates. On a $5,000 gain, the federal difference between a 37% short-term rate and a 20% long-term rate is $850 before state taxes or the net investment income tax. That is why holding periods and lot-level records matter.
Smart tax watching puts more money in your pocket. Knowing when to sell, what to hold, and how dividends affect your taxes can save you significant amounts each year.

Common Mistakes in Investment Tracking
Mistake 1: The Price-Only Trap
Many new investors make the mistake of focusing only on stock prices, but this gives a dangerously incomplete picture. Here's why: imagine you bought 100 shares of a company at $20 each ($2,000 total). A year later, the price is $22. Looks like a 10% gain, right? Not necessarily. Let's look at the complete picture:
- Price increased from $20 to $22 (+$200)
- You paid $50 in trading fees
- The company paid $0.50 per share in dividends (+$50)
- Inflation during this period was 4% (-$80)
- Your broker charges a 0.5% annual fee (-$10)
So while the price gain suggests you made $200 (10%), your actual real-world gain was $110 (5.5%). Checking price-only misses all these crucial elements that impact your true returns. Real portfolio tracking gives you the complete picture: how much money you've actually made (or lost), whether your investments are growing faster than inflation, and if your strategy is working or needs adjustment.
Mistake 2: The Daily Checking Obsession
One of the biggest traps? Obsessing over daily price changes. Imagine you check your weight every hour. Wouldn't it drive you crazy?

It is the same with constantly checking the value of investments. Many beginners compulsively check their investments multiple times a day, leading to stress and potentially hasty decisions. The classic Barber & Odean study, Trading Is Hazardous to Your Wealth, tracked 66,000 households and found that the most active traders earned 11.4% a year vs. a 17.9% market return – a 6.5-point penalty for trading too much. Daily checking can feed the same habit, so set a regular schedule for portfolio reviews, maybe monthly or quarterly, to spot actual trends rather than daily noise.
Mistake 3: The Forgotten Dividends Error
Many investors also fall into the trap of ignoring reinvested dividends in their calculations. Say your shares pay dividends that you automatically reinvest - if you don't count these reinvestments, you're missing part of your actual returns. You're also missing a way to easily track your overall gains. It's like forgetting to count your spare change - it might seem small, but it adds up over time, affecting your overall net worth.
Mistake 4: The Total Neglect Risk
Finally, there's the "set it and forget it" mistake. You might say “But I’m the long-term investor!”. Well, while long-term investing is great, completely ignoring your portfolio for years isn't.
Long-term investors sometimes forget there’s a pretty good chance the strategy they took, or the way they execute it, is not doing the job they intended it to do. Verifying this helps you stay on the right path.
Even if your strategy is a gem, your investment mix naturally changes over time as different investments grow at different rates. For example, if stocks perform exceptionally well, they might grow from 60% to 80% of your portfolio - exposing you to more risk than you planned. That's why occasional portfolio reviews matter: to keep your investment strategy aligned with your goals.
Essential Metrics for Portfolio Performance
That moment had to come finally…now we’ll dive into the numbers that really matter for your portfolio. But don't worry, we'll keep it as simple as possible.
Total Return – The Absolute Must-Know Metric
If you were to measure only one metric, it should be Total Return (TR). It shows everything you've earned, not just whether your stock price went up. What’s the difference? Say you bought a stock for $100, it's now worth $110, and you got $5 in dividends along the way. Your total return isn't just the $10 price increase - it's $15 in total. This single number tells you exactly how much money you've made from your investment. Of course, remember that you have to reduce it by fees and taxes.
Secret Power of Money-Weighted Return (MWR)
Money-Weighted Return (MWR) shows how well your investments performed when you add or withdraw money over time.
Here's a simple example: You put $1,000 into stocks in January, add another $500 in March, and by December your account shows $1,800. How much did you actually earn? At first glance, you made $300 ($1,800 minus $1,500). But that's not accurate because your $1,000 was invested for the full year while the $500 only for nine months.
MWR calculates your true return by considering when each dollar was staked in. It might show your actual return was 15% - higher than the simple calculation suggests. This matters because it helps you tell the difference between good investment results and just adding more money to your account.
Let's compare your investment from the previous example with a savings account: Imagine you put the same $1,000 in January and $500 in March into a savings account with 5% annual interest. By December, you'd have $1,575 ($1,000 × 1.05 + $500 × 1.0375). Your investment account has $1,800, which is $225 more. MWR tells you your investments earned about 15% compared to the savings account's 5%. This clear comparison helps you decide if the extra risk of investing is worth it. Generally speaking, if your strategy beats safer alternatives in the long-term, that's fine. If not, perhaps you need to reconsider your approach.
Think of MWR as your personal investment scorecard - it measures your specific journey, not just the final number in your account.
Time-Weighted Return (TWR) – Judging Strategy, Not Cash Flow
Where MWR rewards (or punishes) the timing of your deposits, Time-Weighted Return (TWR) strips deposits and withdrawals out so you can judge the strategy itself. It is the standard method used in professional performance reporting when the goal is to compare investment decisions independently of external cash flows. The CFA Institute's Global Investment Performance Standards (GIPS), for example, are built around fair and consistent performance presentation.
Quick example: imagine you put $10,000 into stocks in January and they're up 20% by June. In July you panic-add another $50,000, and the market drops 5% by December. Your MWR will be ugly because most of your money was in during the drop. Your TWR will be a calm +14% – because the strategy worked; only your timing didn't. Looking at both numbers tells you which lever to pull next time.
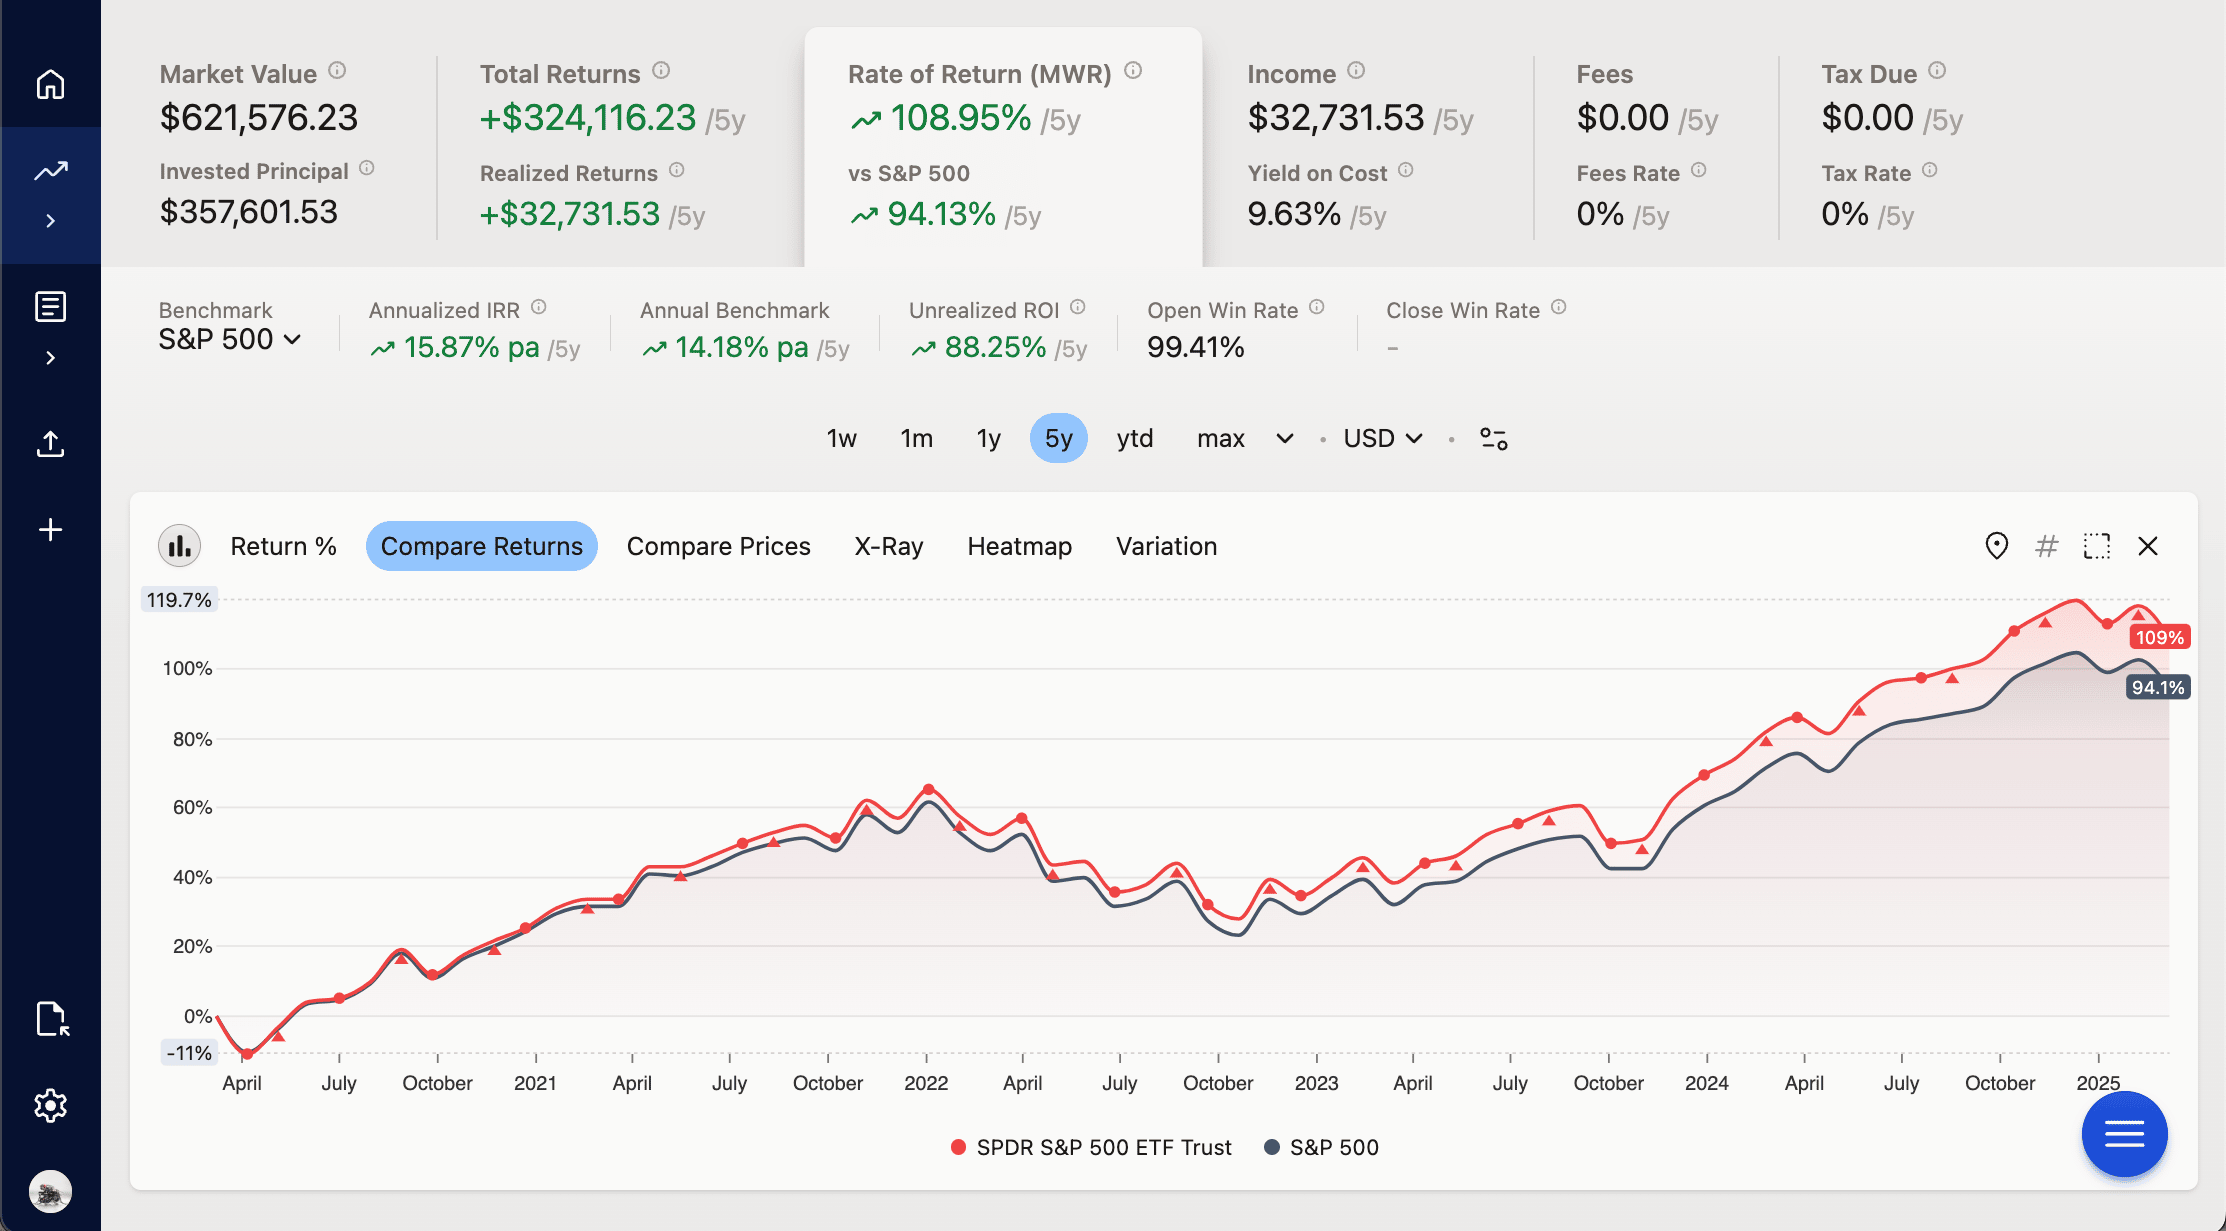
Compare Your Strategy with the Right Benchmark
When it comes to benchmark comparison, think of it as having a measuring stick for your investments. If your U.S. stocks went up 10%, that sounds great - until you learn that the overall market went up 15%. It's like knowing not just your test score, but also the class average.
Common benchmarks include market indexes. If you mainly invest in the US, use an S&P 500 total-return benchmark so dividends are included. If you are diversified around the world, the MSCI World Index is a better fit.
But if you have a typical 80/20 stock-to-bond mix, it's more honest to compare yourself to a blended benchmark or one-fund equivalent, such as a LifeStrategy 80% equity fund or ETF, rather than a 100% stock index.
Side-by-side comparison isn't the only way to use a benchmark. The other technique is discounting — subtract the benchmark from your return so a single number tells you the real or excess result. Discount by CPI for your real return after inflation; discount by S&P 500 or MSCI World for your alpha; discount by a 10Y government bond yield for your premium over a near-risk-free rate; discount by a local House Price Index for how your real-estate holdings did against the housing market. The discount applies uniformly to TWR, IRR, and ROI. A tracker like Capitally pulls inflation, HPI, bond yield, and central bank rate series for 60+ countries directly from Eurostat, the OECD, and the World Bank — see the Benchmarks doc for the mechanics.
What's the difference between S&P 500 Index vs S&P 500 Total Return?
When comparing your investment performance to the market, choosing the right benchmark makes a big difference.
The S&P 500 only shows how stock prices changed. The S&P 500 Total Return shows how much money you would actually make if you reinvested all dividends back into the index. That's it - that's the entire difference. The Total Return version just assumes you put every dividend payment back into the market instead of spending it.
Choose as benchmark the basic S&P 500 when:
1. You regularly withdraw dividends instead of reinvesting them
2. You want to compare just the price appreciation of your stocks
3. You're focusing on growth stocks with low dividends
Use the Total Return index when:
1. You reinvest your dividends automatically
2. You want to measure your portfolio's true performance
3. You hold dividend-paying shares or funds
4. You're evaluating long-term investment performance
Most individual investors should compare their returns to the S&P 500 Total Return because it better reflects how most people invest - keeping and reinvesting their dividends. It's more honest about what you could earn from a simple index fund.
Understand Volatility – The Key to Staying Calm With Investments
Imagine checking your investment worth over time. With some investments, the value changes very little - maybe your $1,000 investment moves up or down by just a few dollars each month. That's low volatility. It's predictable and steady, which is typical for bonds and that’s why many people put money in them.
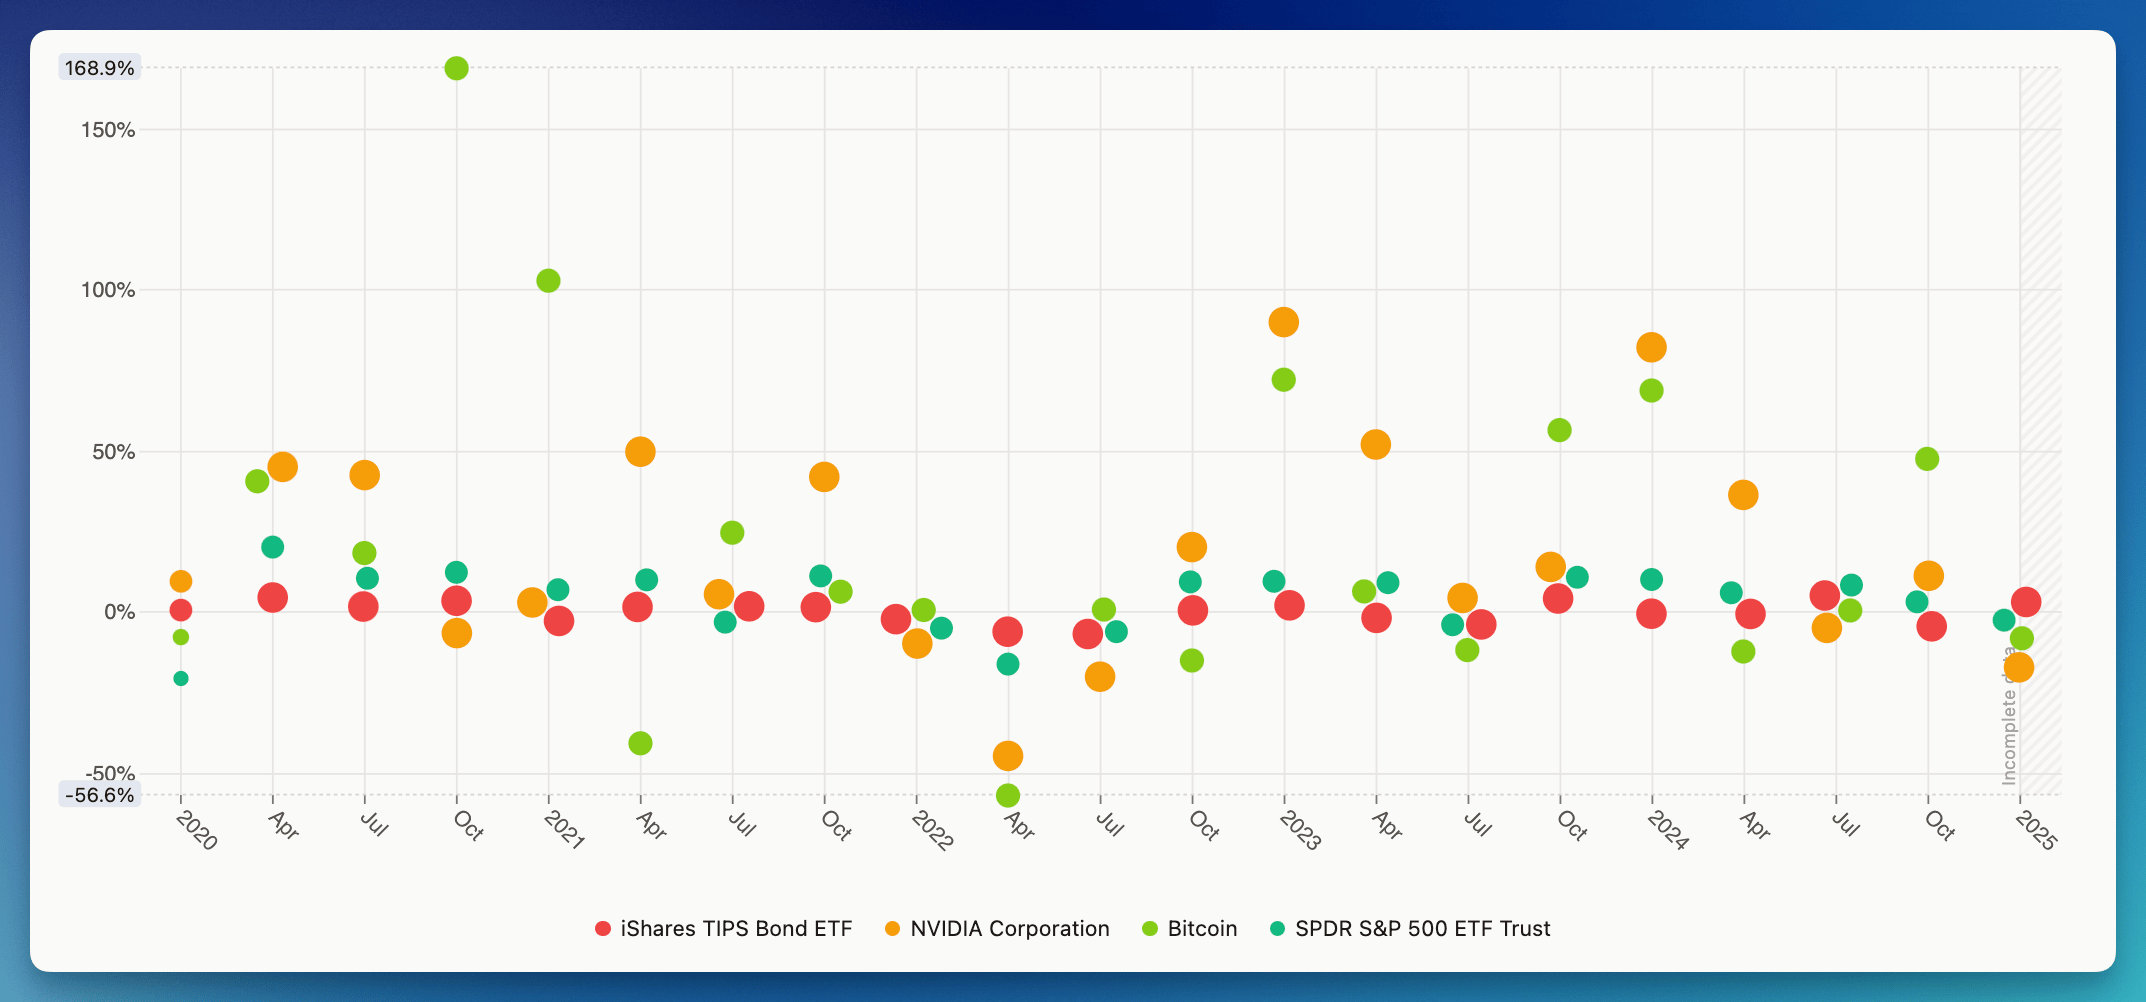 Returns volatility comparison between Bonds, Single stock, Crypto and SPY500 (in Capitally) - would you survive a 50% loss?
But other investments might bounce around a lot more. One day your $1,000 could be worth $1,100, the next week it might drop to $900, then jump back up to $1,050. That's high volatility - common with crypto or stocks, especially small companies but not only. In 2022, Tesla stock swung from $400 to $200 within just a few months. Meanwhile, a typical government bond fund might have moved just a few percentage points during the same time
If it happens to the bonds you put money in, stay calm because it's natural. If you're looking for less volatile assets, take an interest in retail bonds (typically government), which are not traded on the stock market.
Knowing the volatility of your investments helps you:
- Avoid panic selling when big drops happen
- Choose investments that match your comfort level and risk tolerance
- Understand what's normal for your type of investment
- Make better decisions about mixing different investments together
The key is diversification. Pick assets with a level of volatility that lets you stick to your plan without losing sleep. If checking your investment value and seeing it down 20% would make you want to sell everything immediately, you might want to choose less volatile investments.
How to Track All Investments in One Place? Ways to Monitor Investments and Track Your Portfolio
Let's look at how you can track your investments, starting with the most basic approach that the world knows.
Traditional Excel Spreadsheet
Many investors begin tracking with spreadsheets, and for good reason. Spreadsheets offer several key advantages that make them an excellent starting point:
- Complete control over your data and calculations
- Flexibility to customize managing to your specific needs
- Easy to understand your own calculations
- No dependency on external services
- Free to use with basic office software
- Great for learning investment basics
- Simple to start and expand over time with investment tracking tools.
- Works offline!
For investors with simple portfolios or those just starting out, spreadsheets can be an effective solution. As your investment knowledge grows, your tracking methods can evolve too.
You may think of spreadsheets like using a paper map - they still can get you where you need to go, but there are more efficient modern alternatives. The moment you add a second broker, a second currency or a non-stock asset like real estate or an employee share plan, the formulas tend to break before the year is out. That's usually the cue to migrate to a dedicated tracker that can import your existing transaction history and keep doing the maths for you – without losing the historical data you've built up.
Take a Glimpse on Digital Portfolio Trackers!
Modern tools can help you tracking your investments as easy as checking your social media feed. Imagine having a personal financial assistant and investment advisor that automatically records all your investments, calculates your returns, and alerts you to important changes. If you invest in many currencies, in more than 1 asset or through more than 1 broker, they will probably be more useful to you than Excel.
No more manual complex calculations – these apps do the heavy lifting for you. They sit in four broad tiers, each with its own trade-off between convenience, depth and how much of your data you have to share.
We've organized them from the simplest solutions to more comprehensive ones so you can easily choose the best for you:
Tier 1 – Brokerage and bank platforms (a.k.a. single-broker dashboards)
Perfect for beginners and those investing only through a single broker. Single-broker only – they won't consolidate accounts across brokers, currencies or non-listed asset classes. These platforms offer several advantages:
Everything in one place: your checking account, savings, and investments
- Familiar interface you already know how to use
- No need to set up additional accounts or services
- Usually free if you're already a customer
- Simple enough to start tracking investments without feeling overwhelmed
- Good basic reports for understanding performance
They might be connected to your bank, serving as both a budgeting tool and financial goal tracker while also counting your monthly expenses.
However, they aren't designed to manage your portfolio if you have investments across multiple brokers or need detailed performance analysis. For simple financial journeys where your investments live alongside your checking account, brokerage platforms offer a convenient starting point with minimal effort.
Tier 2 – Stock-tracking apps (real-time prices, news and watchlists)
These focus on real-time data from stock markets and deliver the latest news and trading signals. They're great for:
- Instant stock prices and quick updates
- Technical charts and pattern indicators
- Company-specific news alerts
- Suggestions on when to buy or sell
These apps help active traders track stock portfolio changes minute-by-minute and manage frequent trades.
But if you're new to investing or focused on long-term growth, be careful. Taking a glimpse too often can lead to emotional decisions and unnecessary trading. Research shows that constantly checking your investment management tools often results in poorer performance. These apps typically don't show important long-term metrics like asset allocation, tax implications of capital gains, or dividend income based on your trades.
For those investing toward retirement or other future goals and risk levels, these quick-update tools might actually damage your returns by tempting you to make too many trades. They excel at showing what happened in the last five minutes but rarely help you understand if the trades you made align with your long-term financial plan.
Tier 3 – Automated aggregators (Plaid- or Yodlee-backed)
These tools connect to your investment accounts through aggregators such as Plaid, Yodlee or MX and pull holdings into a single dashboard. Depending on the broker, that access may use stored credentials, OAuth-style authorization, or another delegated-access flow. They are convenient if you use several supported brokers and want everything in one view without manual entry.
The trade-off is twofold. First, privacy: you authorize a third party to access your broker data, and that third party talks to your broker on your behalf. If you'd rather keep broker access between you and the broker, skip to Tier 4. Second, fidelity: auto-imports often contain mistakes you'll need to fix manually anyway, most aggregators only pull the last 3–12 months of history, and they typically can't include real estate, employee share plans, stock options or private investments – leaving gaps in your wealth picture and skewing your performance numbers.
Despite these drawbacks, automated trackers work well if you have straightforward holdings across a handful of US brokers and want zero manual entry. They're less ideal if you have complex tax situations, significant non-traditional assets, very old positions, or strong privacy concerns.
Tier 4 – High-fidelity, privacy-first platforms (manual or import-based)
This is the tier built for investors who want depth and control rather than the lowest possible click-count. These platforms rely on CSV/broker-statement imports and manual entry, with no Plaid-style broker aggregation required. Capitally pairs that workflow with end-to-end encryption, EU hosting and GDPR compliance, so broker credentials stay with the broker and portfolio data stays private.
Unlike automated services, they let you import your complete history, not just the last 3–12 months. The biggest benefit? Control. You verify and correct data yourself, which means the analysis you see actually reflects reality – including older lots, splits and corporate actions that aggregators tend to mangle.
High-fidelity platforms help you manage and monitor your complete financial picture. You can include everything at once – stocks, ETFs, bonds, crypto, real estate, employee share plans, stock options, private equity, closed funds, collectibles and even debts like mortgages. That's the only way to get an honest net-worth view, not scattered pieces.
The sweet spot for this tier is investors with multiple brokers, multiple currencies and custom assets, including expats holding accounts across different countries and high-net-worth individuals tracking complex holdings. Multi-currency support with proper FX attribution matters here: a good platform separates how much of your return came from the asset and how much came from the currency move.
On top of that, the sophisticated features reveal patterns that basic tools miss. You can see tax-lot level capital gains, understand what's driving performance (asset, currency or strategy), and plan different scenarios – similar to having a professional advisor, without the fees.
These comprehensive platforms are ideal for:
- Investors with multiple brokers, multiple currencies and diverse asset types (including real estate, employee share plans, stock options and private equity)
- Long-term investors who want precise TWR, MWR and IRR rather than a broker's marketing chart
- Privacy-conscious people who want to avoid account aggregation, bank sync and shared broker credentials
- EU investors who care about GDPR compliance and end-to-end encryption
- Expats and high-net-worth individuals with cross-border accounts and complex tax situations
- DIY investors willing to invest a little time upfront for better long-term insights
- Tax-focused investors who need complete historical records and tax-lot level reporting
With these tools, you can see exactly how your portfolio is performing while keeping complete data control. You can also choose to enter everything manually if privacy is your top priority, then layer in broker file imports later as you get comfortable.

Remember, you don't have to stick with your first choice forever. Many investors begin with simpler tools and gradually upgrade to more comprehensive solutions as their needs evolve. If you'd like a side-by-side feature view, our best portfolio tracker for the modern DIY investor comparison goes deeper. The key is finding a way to track your investments consistently, whatever method you choose.
From Just Tracking to Managing: A Smarter Way to Track Your Net Worth
As we said, many people focus solely on stock prices, but successful investing requires a broader view. Portfolio management brings together all aspects of your investments into a clear strategy that works for you. But before you can smartly manage your investments, you need 4 key elements:
1. Specific Goal
Forget vague ideas like "making money" - your goals need to be specific. Consider these examples:
- I need $50,000 for a home down payment in five years
- I want to build a $1 million retirement fund by age 60
- I'm aiming for $2,000 monthly passive income from dividends by age 50
These clear targets will shape every investment decision you make. For instance, the down payment goal might lead you toward more conservative investments since your timeline is shorter, while the retirement goal allows for more growth-oriented choices.
2. Strategy
Once you know where you're headed, you choose the right mix of investments to get there. This article by Vanguard will tell you how to easily choose the right assets.
For beginners, you don't need a custom-made strategy. Popular approach will be more than enough for you. Bankrate did a great job describing the 5 most popular strategies for individuals, so start by reading their article.
Your strategy needs to match the market you're investing in, your age, and the currency you earn and spend in. Younger investors can take on more risk with more stocks, while those approaching retirement might want a safer approach. Equally important is your base currency - if you earn and spend in euros, having too much invested in dollar-based assets adds currency risk to your portfolio.
The Age-Based Portfolio Rule
The simplest way to decide how much to invest in stocks is the "100 minus your age" rule. This suggests that the percentage of your portfolio in stocks should be 100 minus your current age. The rest goes into safer investments like bonds.:
If you're 30 years old: 100 - 30 = 70% in stocks, 30% in bonds
If you're 60 years old: 100 - 60 = 40% in stocks, 60% in bonds
Nowadays some advisors suggest using 110 or even 120 instead of 100 because people are living longer today. This gives you more growth potential throughout retirement. Whatever number you choose, this rule offers a simple starting point that automatically becomes more conservative as you age.
3. Execution
This is where you put your strategy into action and begin overseeing your investments. Tracking isn't just collecting data - it's about verifying you're making progress toward your goal.
For instance, if your goal requires a 6% annual return but results show you're only achieving 4%, you can make adjustments early rather than discovering the shortfall years later.
4. Optimization
A good tracking tool helps you find ways to improve your investments. It can show you:
- When your mix of investments has changed because some grew faster than others
- If you're paying too much in fees compared to similar options
- Which pieces of your whole wealth aren't performing as well as they should
With proper tracking, you might discover that too much of your money is in one type of investment, letting you spread it out better to reduce risk without sacrificing returns.
Or you might confirm that your simple 80/20 approach is on track and requires only small adjustments once a year using an investment tracker. That’s fine too! Either way, you'll know for sure.

Ready to Choose Your Investment Portfolio Tracker?
As you can see, choosing the right tool to monitor investments is crucial. It will allow you to test your strategy, help you persevere when stock markets starts fluctuating, and simplify rebalancing.
But understanding what to follow and why is even more important! Without clear purpose, even the best platform becomes just another dashboard with meaningless numbers. The metrics you use to analyse your portfolio should directly connect to your investment goals and help you make better decisions.
The key is finding a solution that lets you see your entire investment portfolio while matching your personal habits – because the best method is the one you'll actually use consistently. Your tool should let you track stocks while you also monitor bonds, real estate, employee share plans, stock options, crypto and any other assets that make up your overall portfolio.
Frequently Asked Questions
Use a high-fidelity tracker that supports CSV import, broker statement uploads or manual entry instead of relying on aggregators like Plaid or Yodlee. You stay in control of your data, you can include accounts and assets the aggregators don't cover, and a privacy-first platform like Capitally can keep everything end-to-end encrypted so no third party — including us — can read your holdings.
Tier 4 platforms are the realistic answer. Broker dashboards only know about their own securities, and most automated aggregators silently drop anything they can't fetch from a feed. A high-fidelity tracker lets you add custom assets — real estate, employee share plans, stock options, private equity, closed funds — with their own valuation history and cash flows, and rolls them into the same TWR/MWR/IRR view as your listed holdings.
Pick a multi-currency portfolio tracker that records every transaction in its native currency and reports your performance in your base currency with proper FX attribution — it tells you how much of the return came from the asset and how much from the currency move. This matters most for expats and investors with accounts in multiple countries, where currency drift can quietly add or subtract several percent a year on top of the underlying performance.
Good luck with your investments!