Changelog
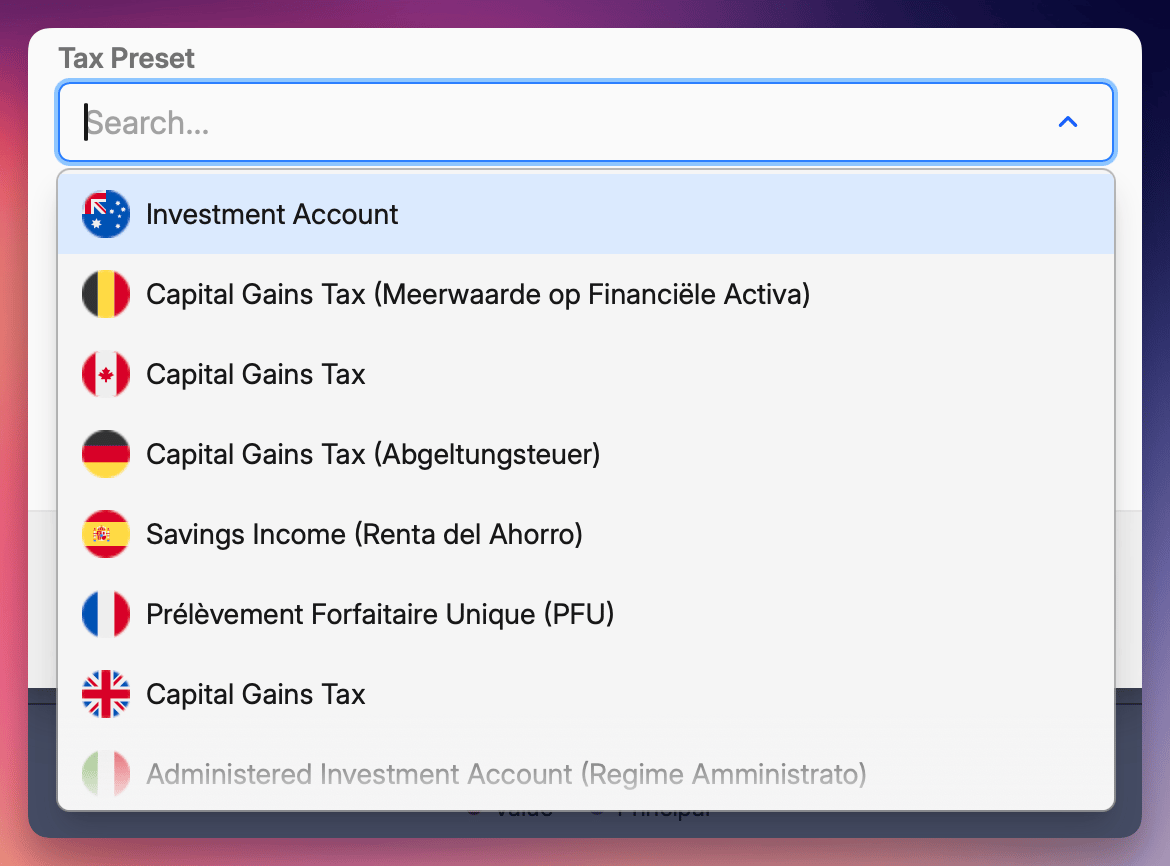
Just in time for tax season! We've added ready-to-use tax presets for:
- 🇦🇺 Australia
- 🇧🇪 Belgium
- 🇨🇦 Canada
- 🇩🇪 Germany
- 🇫🇷 France
- 🇸🇪 Sweden.
Each preset comes pre-configured with the correct tax rules for your jurisdiction - including capital gains rates, holding period benefits, and the right cost basis method. Just select your country in Reports → Taxes Due and let Capitally handle the calculations.
We've also updated presets for 🇬🇧 UK, 🇺🇸 US, and 🇳🇱 Netherlands with improved accuracy.
Cost basis methods
To support these new jurisdictions, we've added flexible cost basis methods: FIFO, LIFO, Highest Cost, Lowest Cost, Average Cost Basis and manual lot selection.
You can even change your preferred method at the asset, account or position level if needed.
Learn more in our Cost Basis Methods guide.
Undo/Redo shortcuts
Press Cmd/Ctrl+Z to quickly undo any change, and Cmd/Ctrl+Shift+Z to redo
Derivative asset type
Track futures, T-Bills, and other derivatives with proper categorization
Italian language support 🇮🇹
Italian joins our growing list of supported languages. You can now use Capitally entirely in Italian, and our community forum supports Italian discussions as well. Switch languages anytime from Settings → Profile or the login screen.
Customize your tables
Tables throughout Capitally are now much more flexible. You can drag columns to reorder them, and resize any column by dragging its edge. Double-click the resize handle to snap a column back to its default width.
Finding columns is also faster - just use the search box in the column picker to quickly locate what you need among the many options available.
Wiiide portfolio table
Portfolio table can now pack as many columns as you need and will scroll horizontally if it's too much. This works on mobile too if you rotate your phone to landscape!
New period return columns
We've added a set of return columns for common time horizons: 1 month, 3 months, 6 months, 1 year, 3 years and 5 years.
These come in two flavors:
- Returns - shows your actual returns for the positions, accounts or whatever you're looking at in the table
- Asset price returns - shows the underlying asset's price performance over that period, useful when comparing how the market moved versus how your holdings performed (available on Positions, Assets and Lots tabs)
Managed asset type
A new asset type called Managed is now available for tracking managed accounts - think wealth managers, discretionary portfolios, or any account where someone else handles the investment decisions on your behalf.
Stock Options
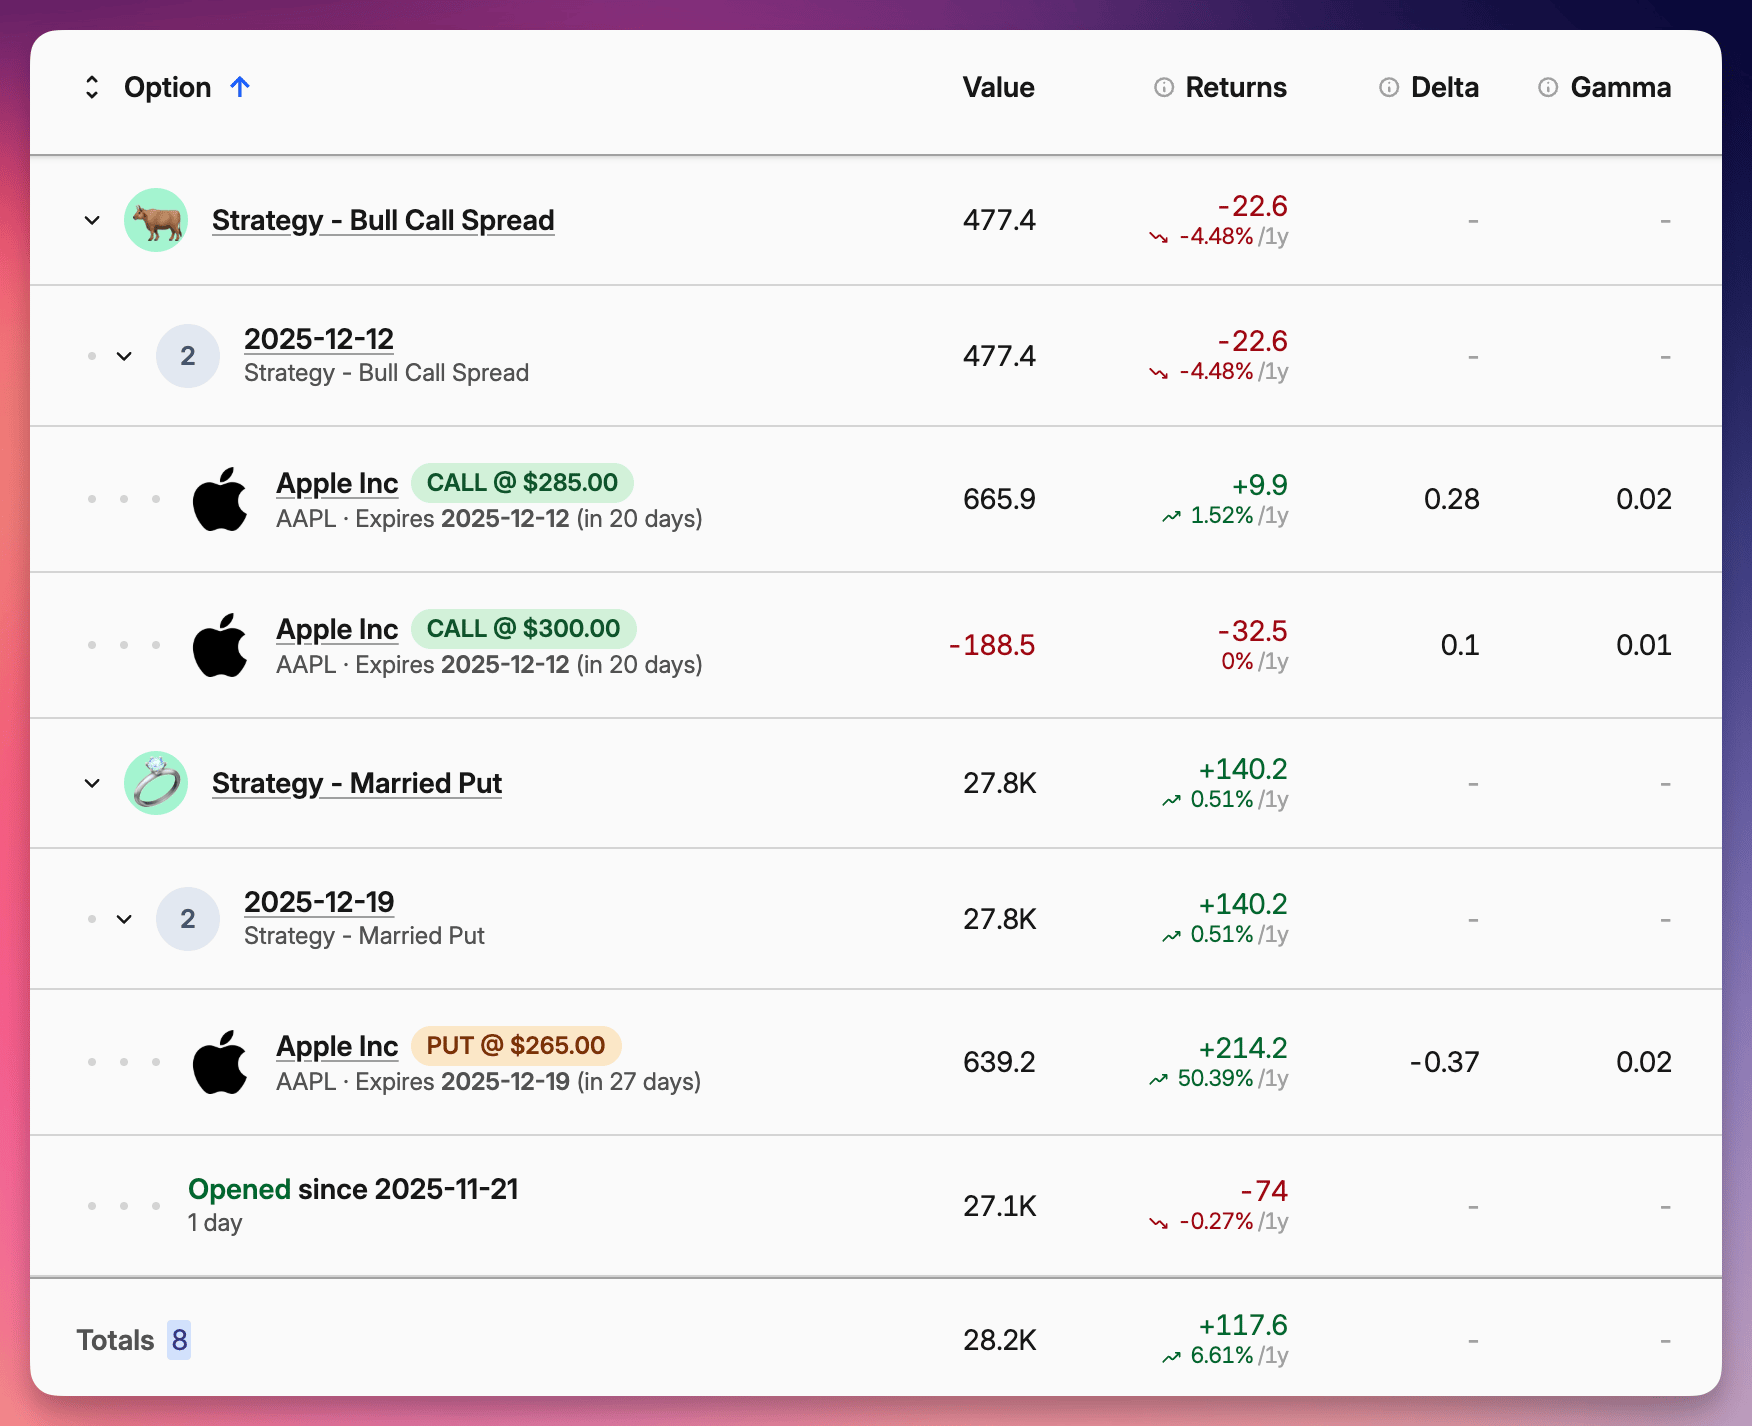
You can now import options directly from Interactive Brokers or add them manually, using any asset as the underlying. We automatically calculate their fair price using Black-Scholes-Merton (European) or Barone-Adesi-Whaley (American) models. Their performance along with relevant greeks is displayed in an all new Options tab.
If you trade strategies, Capitally will bundle multiple legs together under a single Lot Group - a new feature applicable not only to options. You can analyze the strategy as a whole or dig into individual components.
Margin Requirements
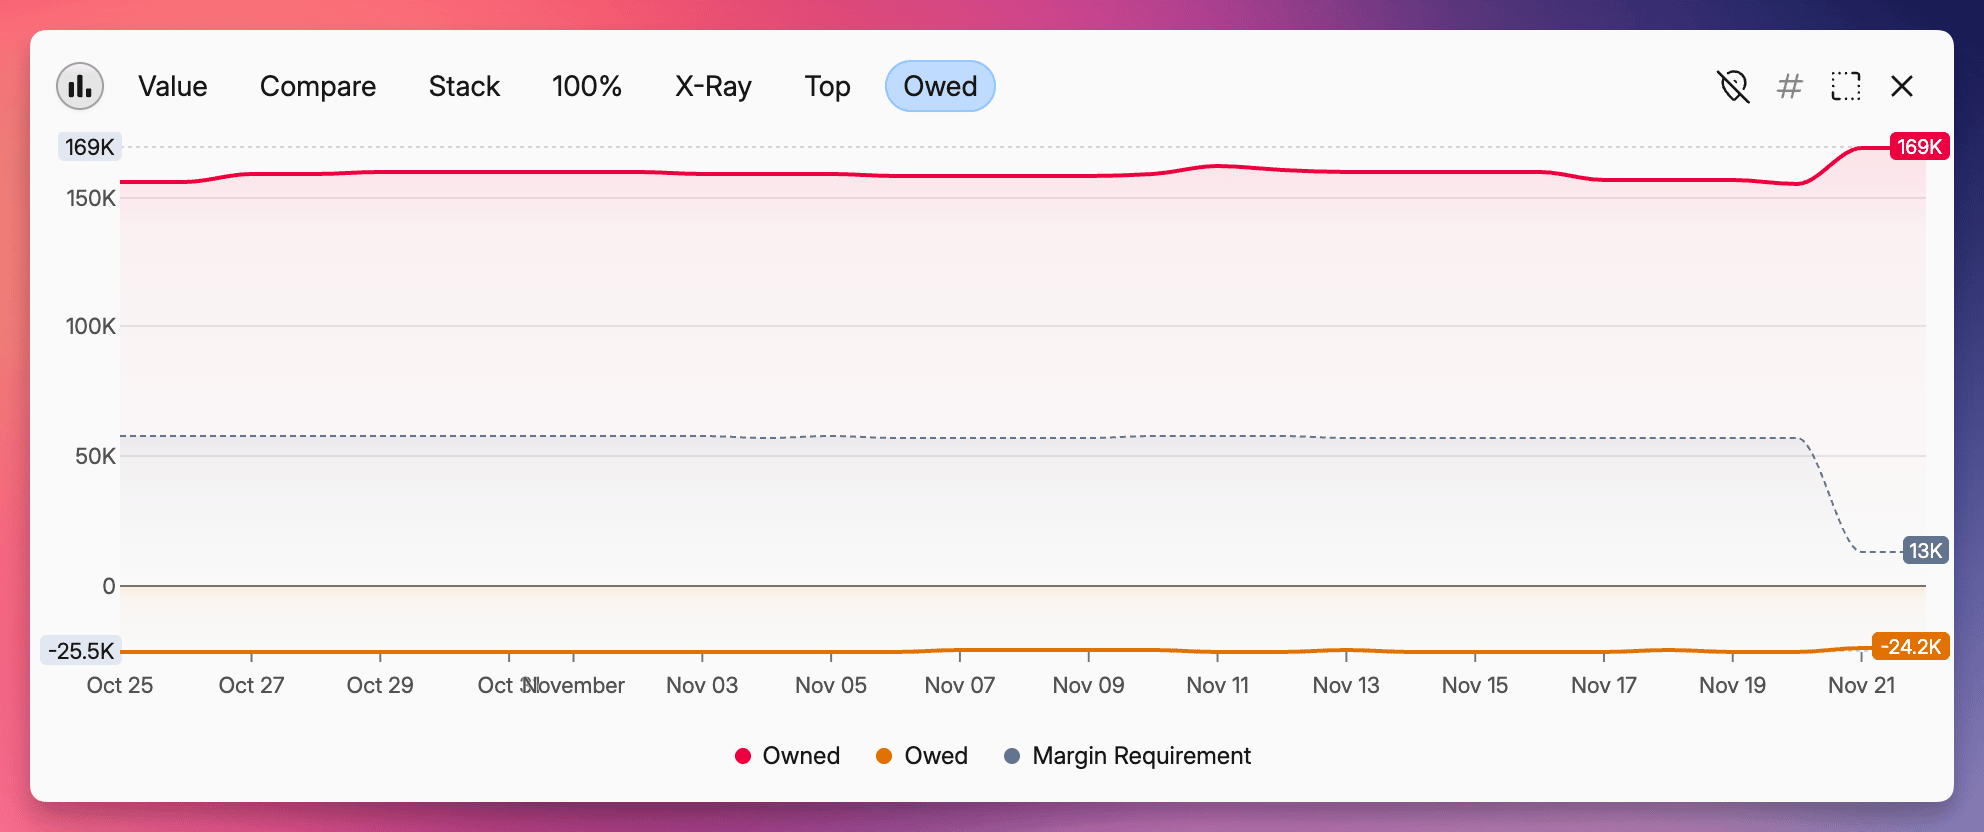
When shorting stocks or options, visualization is a helpful safety tool. You can now check your margin requirements right on the Owed chart. It will display a dotted line indicating the minimum assets required on your account to avoid a margin call, helping you keep an eye on your safety buffer.
Value-based Asset Pricing
Sometimes you invest in a "black box" - like a wealth manager or a private fund - where you only know how much cash you put in or out and the current total value (NAV), but not the specific share price or underlying assets.
By enabling Value pricing on an asset, you can just enter the cash flows as Transfers and the current Net Asset Value by updating the Account Balance. We take care of calculating the true performance metrics from these data points. You can enter these by hand, or via a new custom import template called Account Cashflows.
New Captain Plan
These advanced features are available on our legacy Founders plan and the new Captain plan (€250/year). This tier is built for complex wealth management, with unlimited projects and support for Private Equity tracking is coming soon.
The translations are now live for everyone!
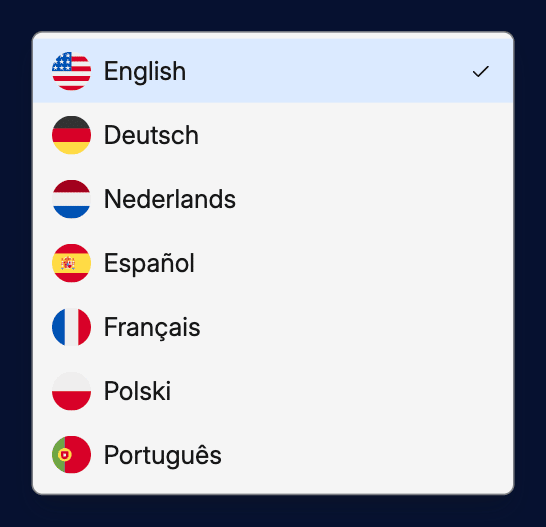
You can switch between English, German, Dutch, Spanish, French, Polish, and Portuguese directly from the login screen or anytime in Settings → Profile. Every corner of the app now works in your preferred language - from portfolio analytics to transaction imports.
The community has gone multilingual too!
Pick your language from the selector in the top bar, and all discussions instantly appear in that language. You can write posts and comments in your native language, and they'll be automatically translated for other members. Want to see the original text? Just toggle the localization switch to turn off translations.
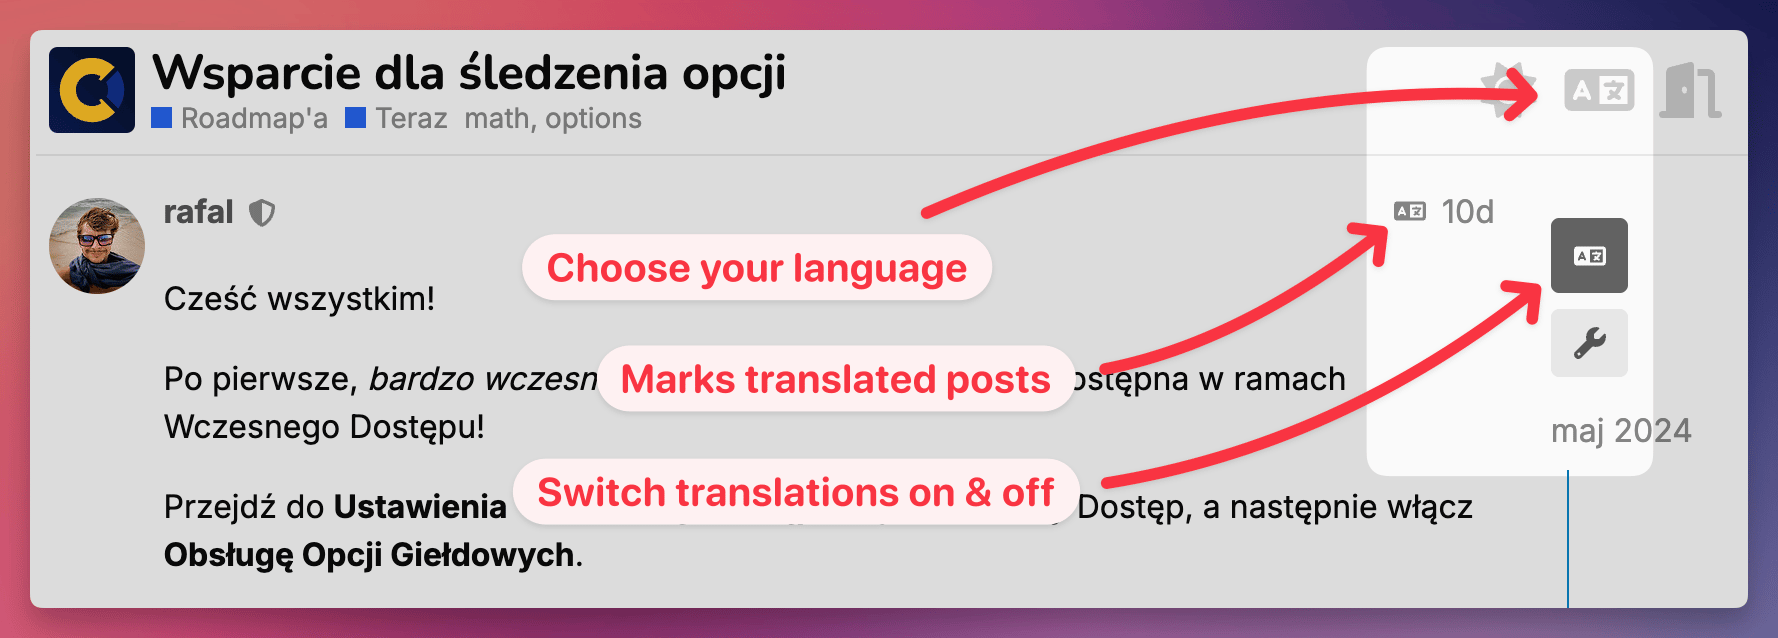
We're continuing to polish translations based on your feedback. If you spot anything that needs improvement, join the discussion in our dedicated community thread or reach out to support. The website and help docs are next on our translation roadmap.
We're excited to share two major features that are now available in Early Access. You can help us refine them before the full release by enabling Early Access in your settings.
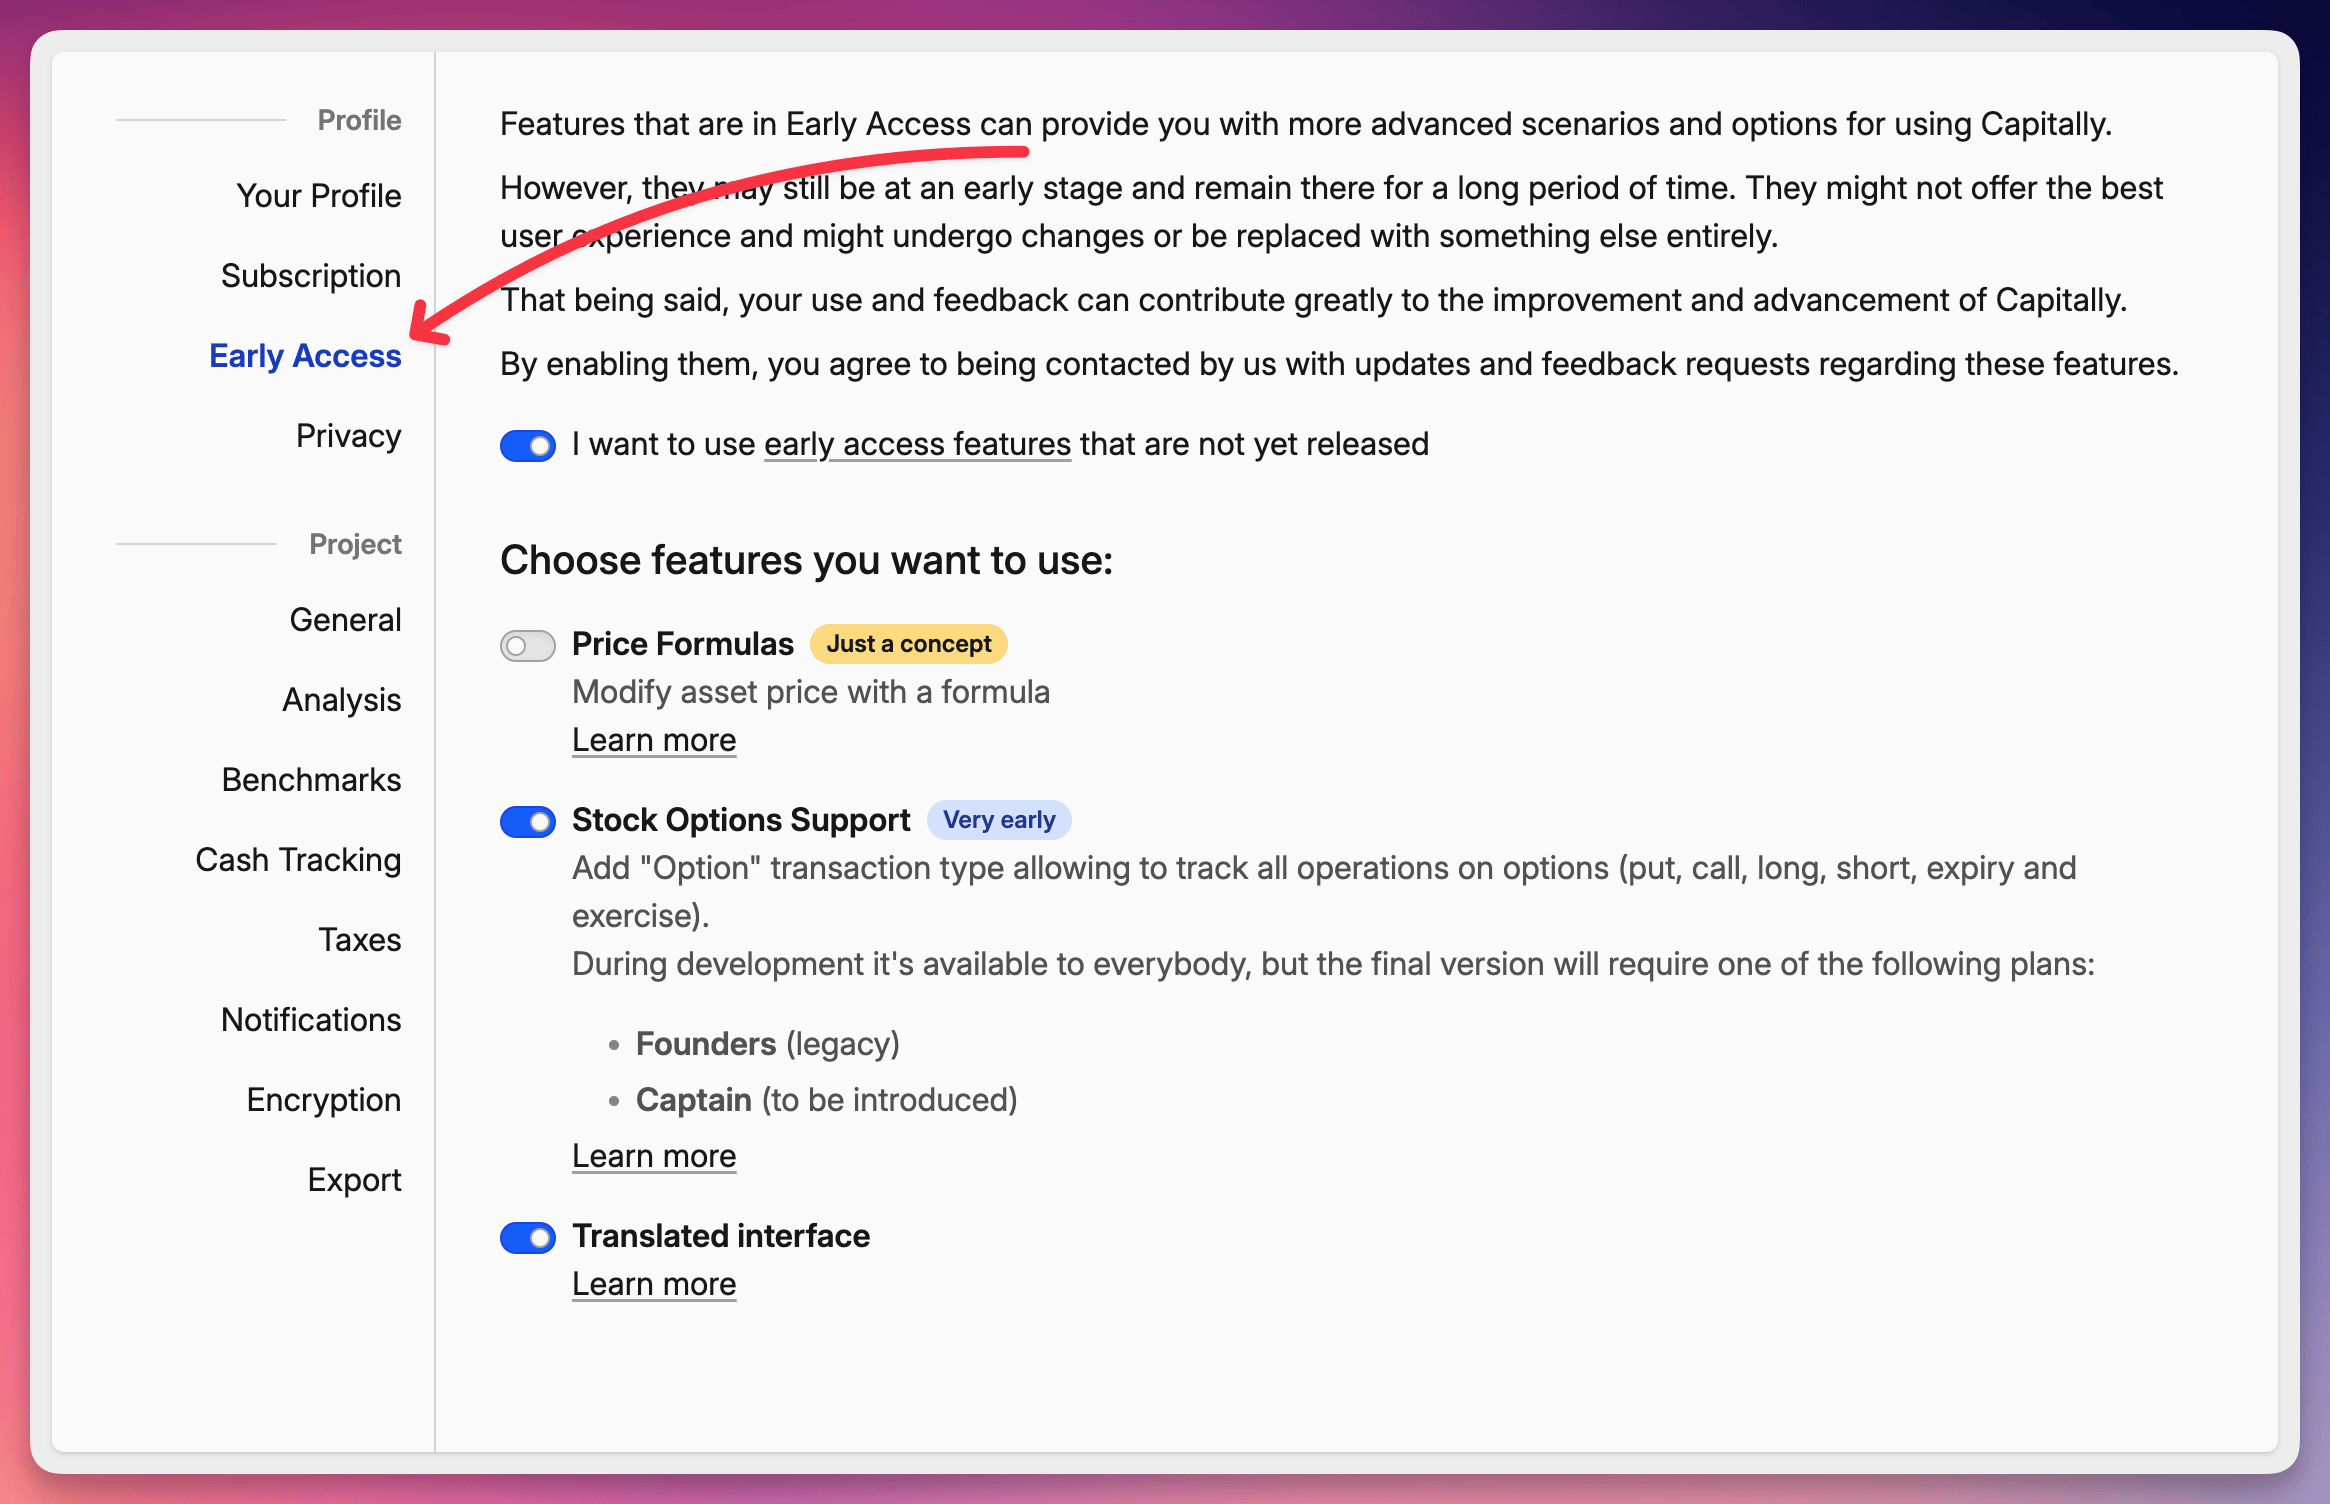
Multi-language support - now in 7 languages
Capitally will be soon available in seven languages: English, German, Dutch, Spanish, French, Polish, and Portuguese. We've translated everything - from the interface to import presets, tax configurations, categories, and sectors. That's thousands of text elements localized for each language with the best AI models available.
Since this is such a comprehensive translation effort, we'd appreciate your feedback. If you notice any translations that could be improved or text that breaks the interface layout (especially on mobile), please let us know in our community thread on translations.
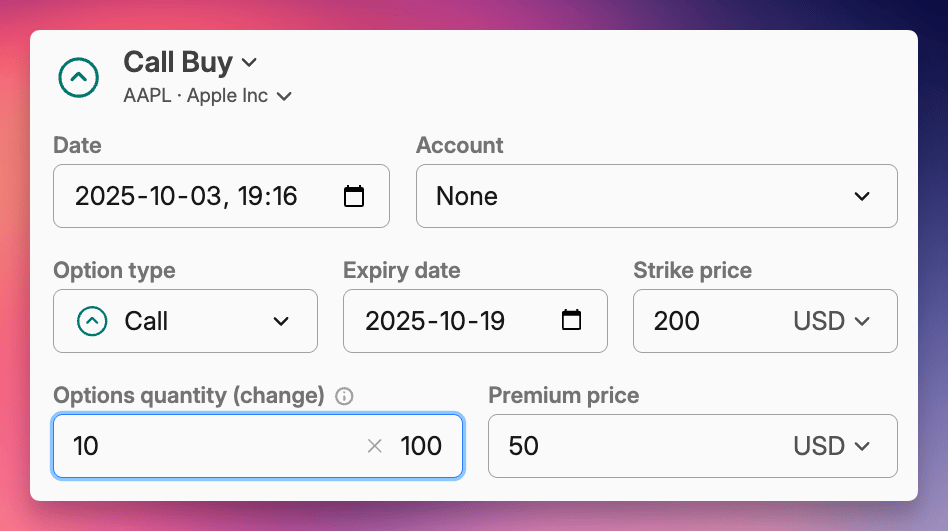
Stock options tracking
You can now try out tracking stock options in Capitally - both puts and calls, long and short positions. The system handles automatic expiration and execution, calculating your returns across both the underlying asset and the option itself.
Options work with any asset type, not just stocks. Import from Interactive Brokers and other supporting brokers is coming soon.
Join the discussion about options tracking in our community thread.
Automatic tax withholding on income transactions
You can now configure automatic tax withholding percentages for dividends and interest payments that Capitally generates for you.
Set your tax rate at any level that makes sense for your situation:
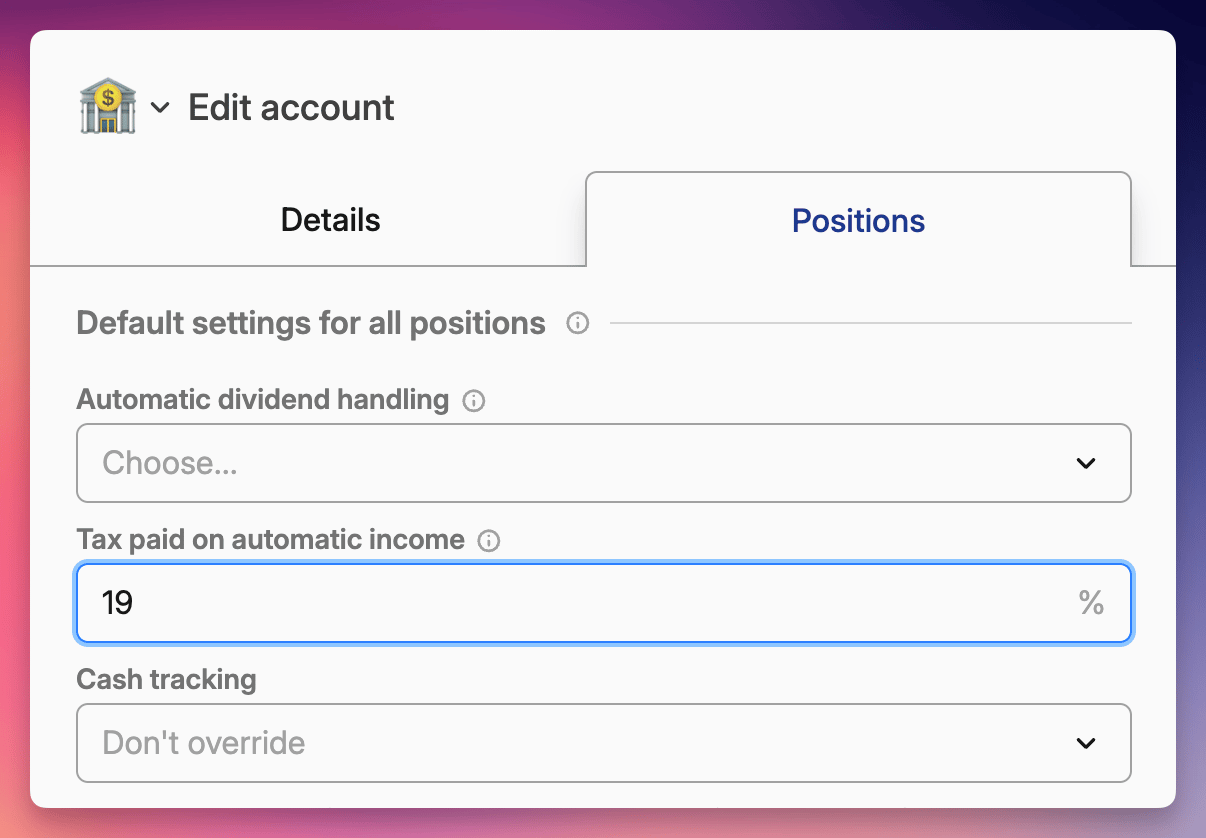
Account level - applies to all positions in that account
Asset level - specific rate for a particular stock or bond
Individual position - override for a single holding
To configure this, edit your account or asset, navigate to the Positions tab, and enter the tax paid percentage that your broker typically applies. From now on, all automatically generated income transactions will include the correct tax withheld amount.
This feature only affects transactions that Capitally creates automatically - it won't modify transactions you import from your broker, ensuring your actual broker data remains unchanged.
Important distinction: Tax withheld (deducted at source by your broker) is different from tax due (what you'll need to pay to tax authorities later). This feature handles the former.
New income tracking columns
We've added three helpful columns to give you better visibility into your income streams. You can now enable these in both the Positions and Assets tabs:
Next income payment - see when your next dividend or interest payment is expected
Final interest payment - track the maturity date for bonds and fixed-income investments
Current interest rate - monitor the yield on your interest-bearing assets

Capitally just became the first wealth tracker with truly comprehensive interest-bearing asset support!
You can automatically calculate interest accruals, payments, and principal repayments for everything from government bonds, deposits, margin accounts, mortgages to peer-to-peer loans - all based on the exact terms you specify.
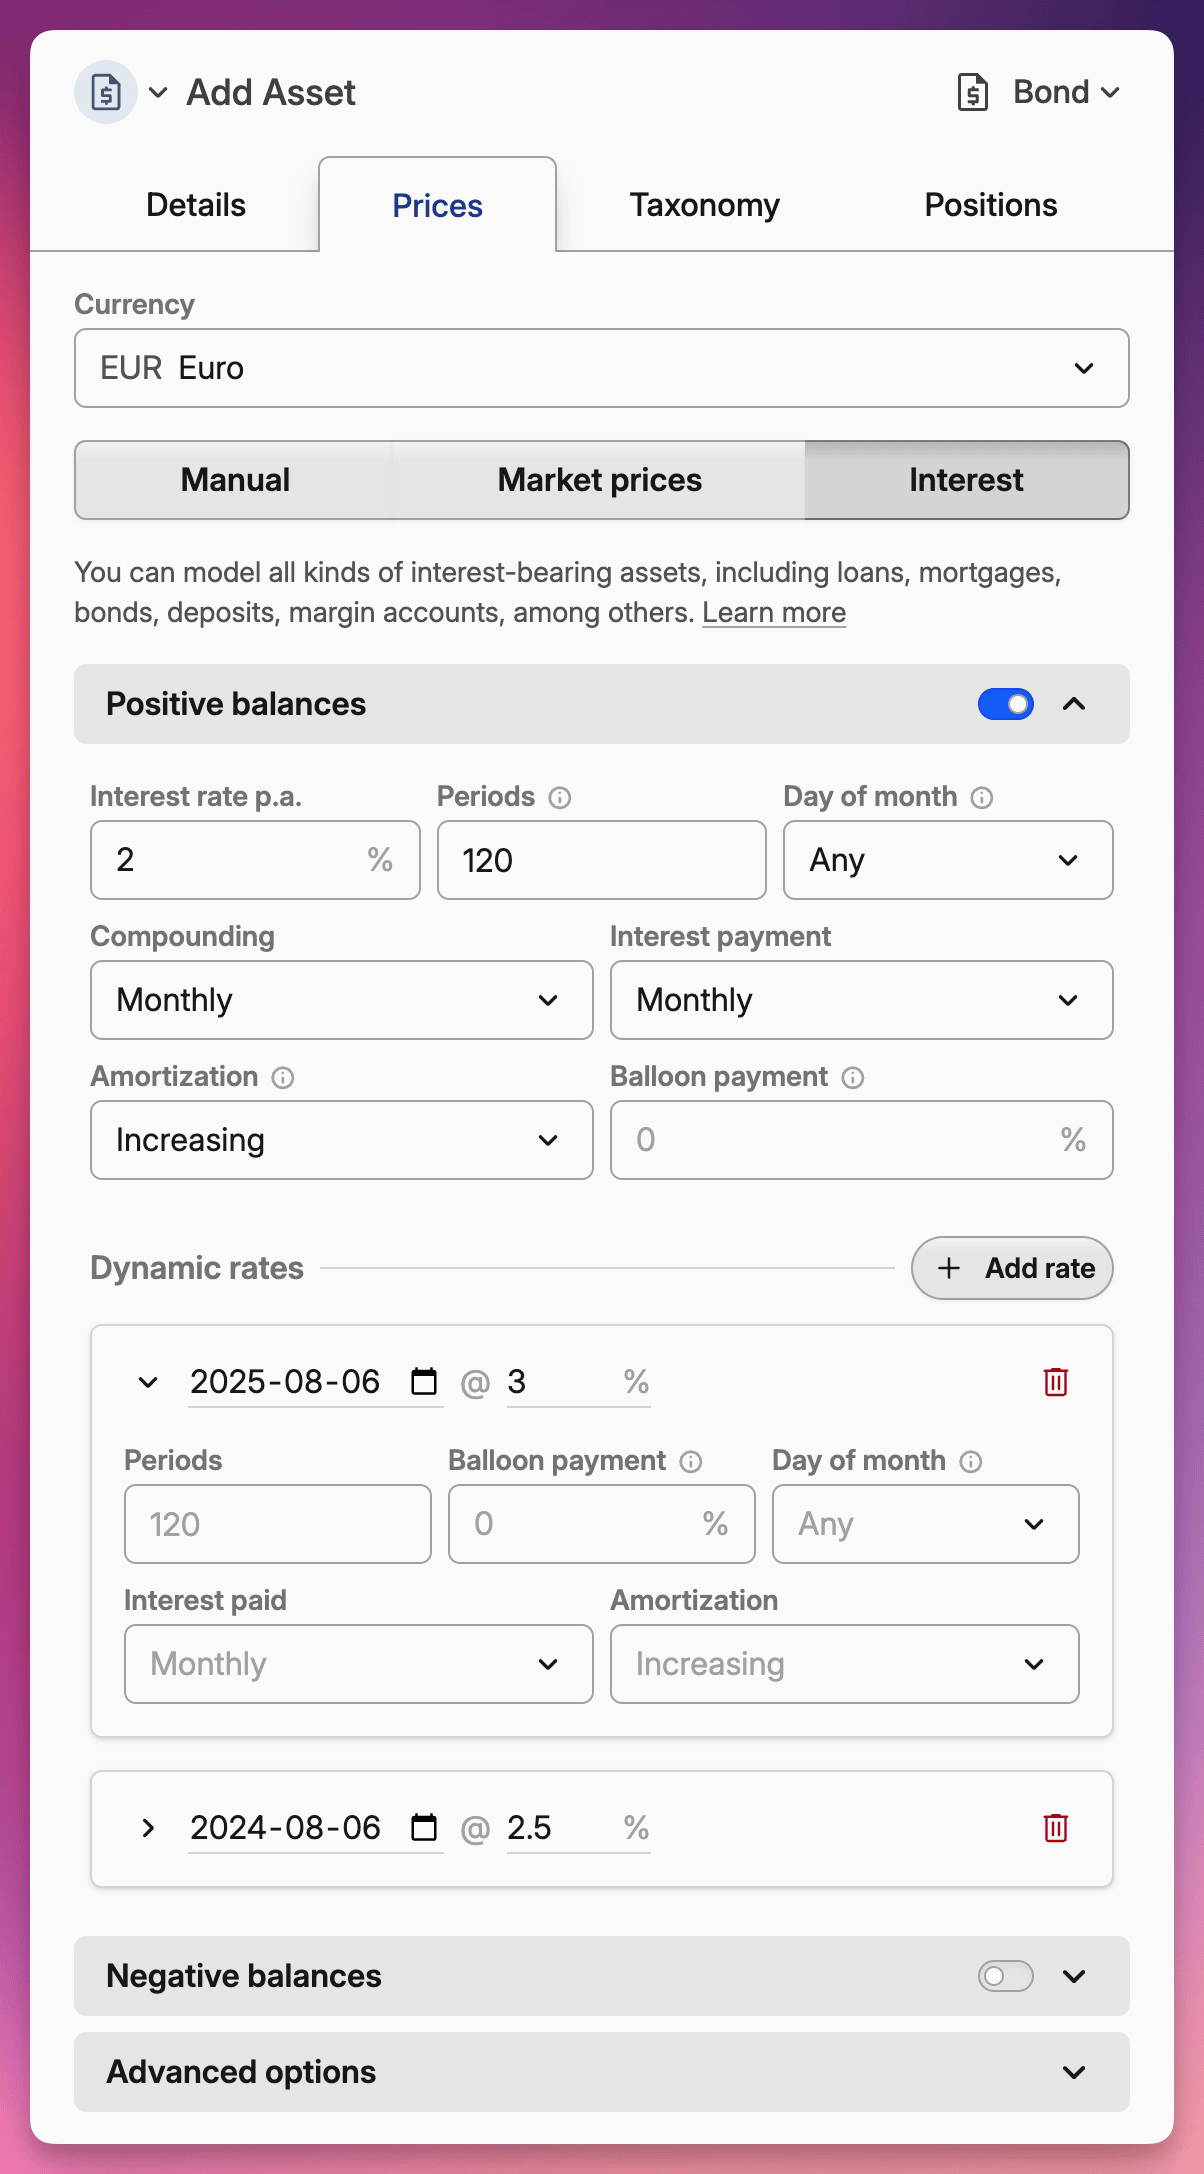 There are LOTS of options to cover all kinds of assets and liabilites
Automatic interest calculations – Set your interest rate, compounding frequency, and payment schedule once. Capitally generates all future cash flows automatically, eliminating manual entries for each coupon payment or loan installment.
Both sides of the balance sheet – Track assets that earn interest (bonds, CDs, savings accounts) and liabilities that cost you interest (mortgages, loans, overdrafts). Each side gets independent rates and terms, so your checking account can earn 0.5% on positive balances while charging 15% on overdrafts.
Real-world complexity made simple – Adjustable-rate mortgages? Promotional credit card rates? Bonds with balloon payments? Add rate overrides on specific dates to model exactly how your assets behave. You can even simulate payment holidays or early repayments.
Professional-grade accuracy – Choose from different day count conventions (Actual/Actual, 30E/360) to match your bond's prospectus. Set custom amortization schedules. Round coupon payments to match real-world precision.
Built-in scenario planning – Test how rate changes affect your portfolio value or compare refinancing options before pulling the trigger. See the impact of making extra principal payments or extending your loan term.
Built-in support for Polish government bonds – A long requested feature, just search for the bond's name or use the new importer to have them automated.
The feature integrates seamlessly with your existing data - imported interest transactions are automatically detected and won't create duplicates. You'll find the new pricing method when adding or editing any asset.
This has been brewing in early access for weeks, and we're thrilled to finally release it to everyone. Thanks to all the early-access users who helped us nail down the calculations and polish the experience.
Interest calculations involve complex variables and different calculation conventions. While we've worked hard to ensure accuracy, always verify important calculations against your official documents.
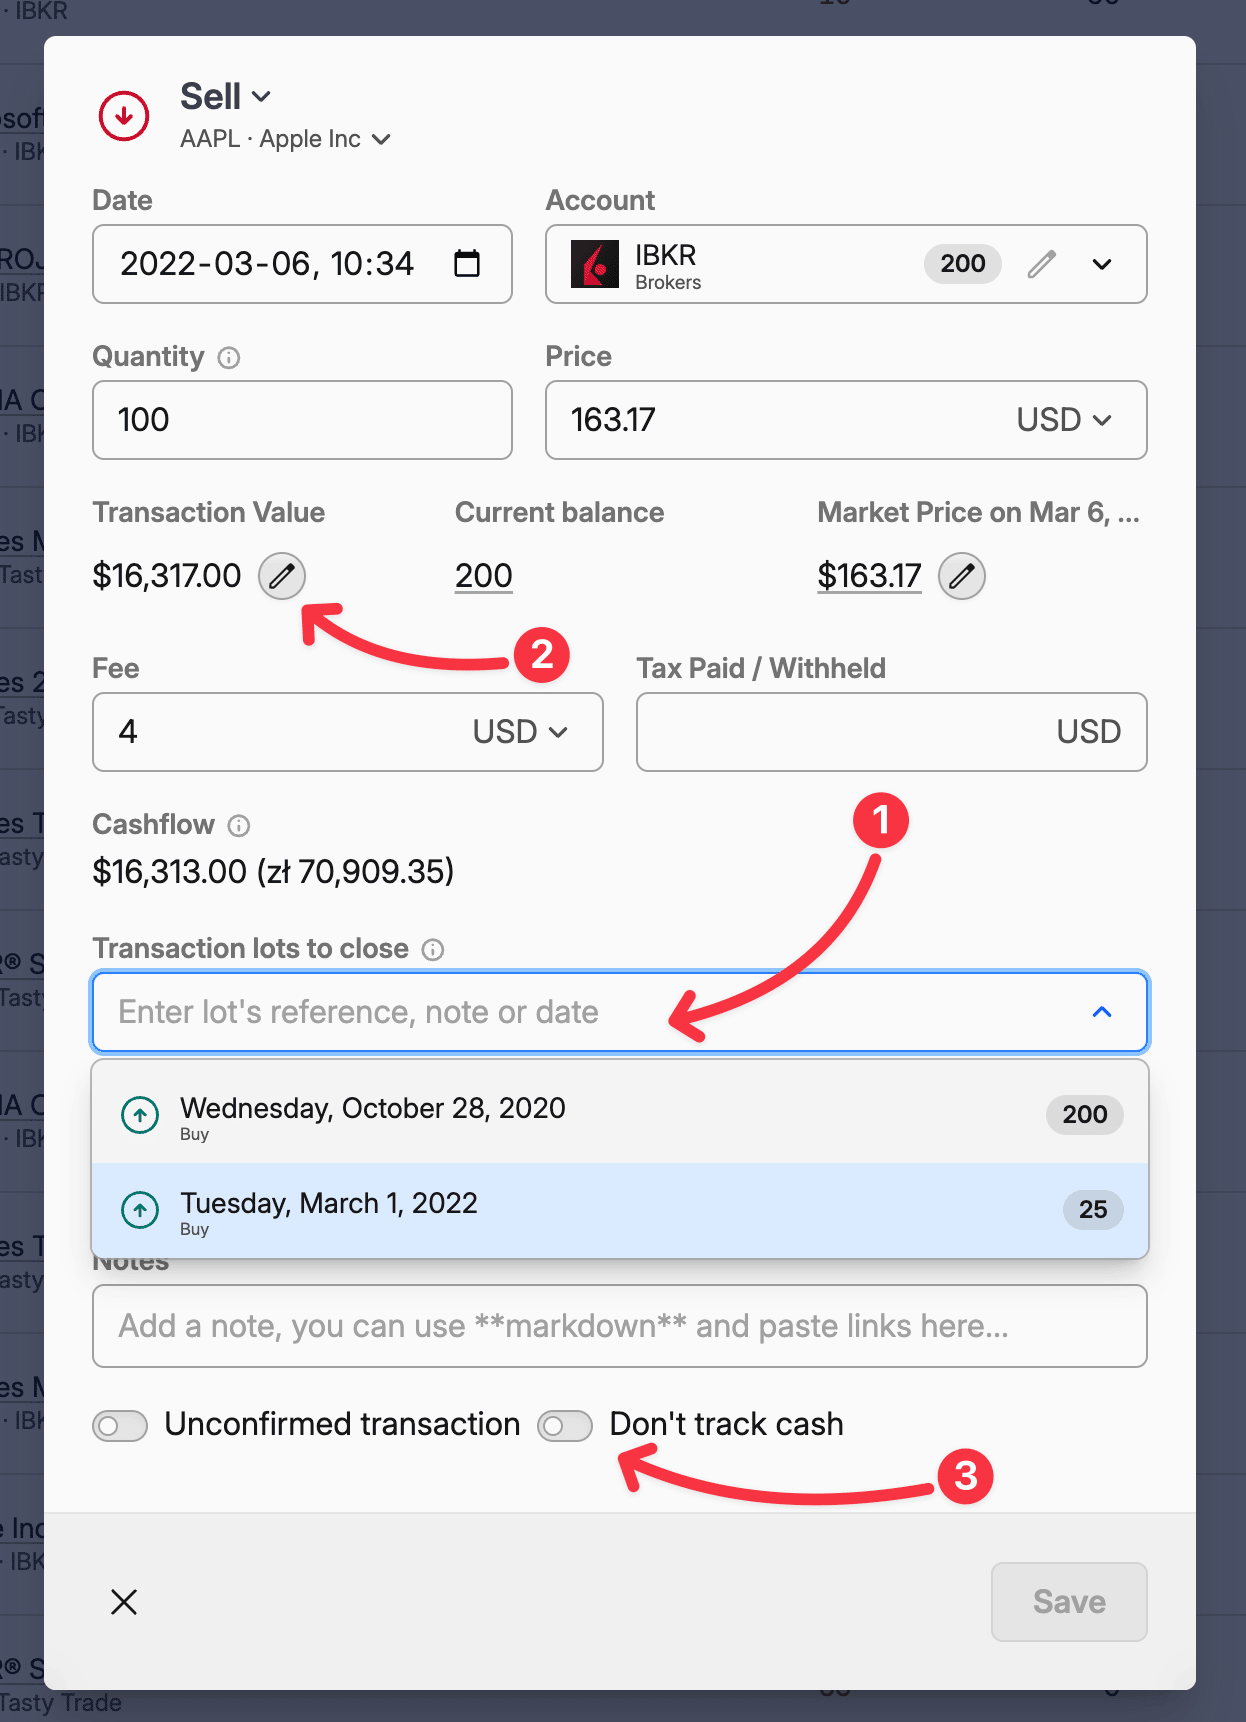
Three notable changes when editing Transactions:
You can now manually pick which transaction lots should be closed by the transaction. In some tax jurisdictions you're allowed to set this to optimize your taxes. But you can also use it for other assets, where it's important which lot is depleted first. Only lots that are available at the date of the transaction are displayed, so you may need to edit earlier transactions if the lot you wanted is already closed.
You can type the transaction value, instead of the price. Just click the edit button next to the value. You'll need to enter the quantity first.
You can disable cash tracking for a single transaction.
Very small positions are considered closed
Rounding errors can sometimes leave tiny quantities of a position open. These negligible positions are now automatically considered closed. The threshold varies by asset type: less than 0.01 for cash, less than 0.000001 for crypto, and less than 0.0001 for all other assets.
You can set your own precision level to suit your needs in Settings -> Analysis.
Asset taxonomies update automatically
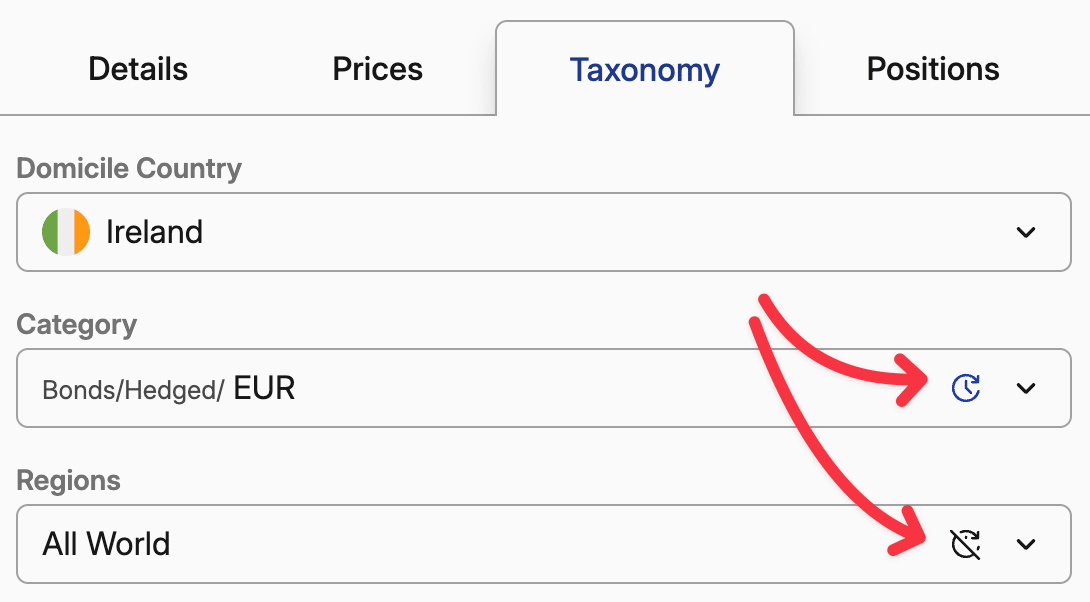
Previously, asset taxonomies—such as category, region, and sector—were static and required manual updates. Now they're refreshed automatically every few days to ensure your data stays current and accurate.
If you prefer to maintain custom taxonomies for specific assets, you can disable automatic updates for individual assets or turn off the feature entirely in Settings → Analysis.
P.S.
There were a lot of new versions, but not many changelog entries. This is because we're not-so-secretly brewing support for Interest-based pricing - like bonds, loans, mortgages or deposits. It's mostly ready — you can check it in the early access or wait til next week for a full release.
We've completely revamped how numbers and dates are displayed throughout Capitally, giving you control over your preferred formatting. Configure these settings in your profile to match your needs.
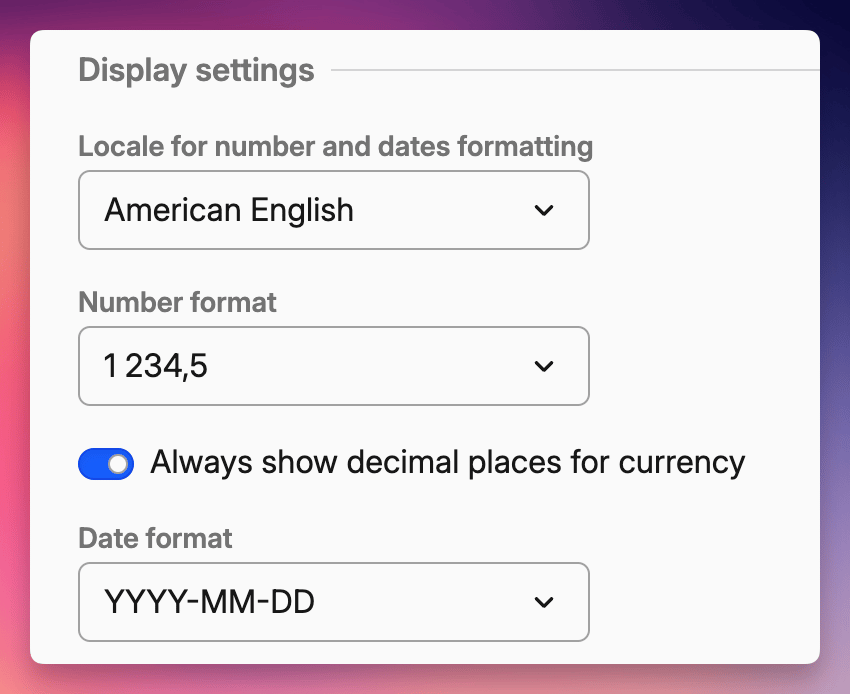
What's new:
• Flexible formatting options – Choose between specific number and date formats or use your locale's defaults
• Intelligent decimal precision – Small values display more decimal places for accuracy, while larger numbers are rounded for better readability
• Currency precision control – Enable the new Always show decimal places for currency option when you need consistent precision in financial data
• Universal compact notation – Large numbers in narrow spaces are now consistently abbreviated across all locales (1K for thousands, 1M for millions, etc.), making it easier to scan and compare values at a glance
Automatic cash tracking is finally available for everybody! Once enabled, it will keep your cash balance accurate based on the cash flows of transactions you've added.
It will be enabled by default on new projects. For existing ones, you just need to go to Settings → Cash Tracking and enable it for your project.
Flexible Configuration
You can configure cash tracking globally for your entire project, or enable it only for specific accounts, assets, or even certain currencies. By default, we track currencies within the same account (e.g., your broker account), but you can also choose a dedicated account for cash tracking or select a single currency to convert all cash transactions to and from.
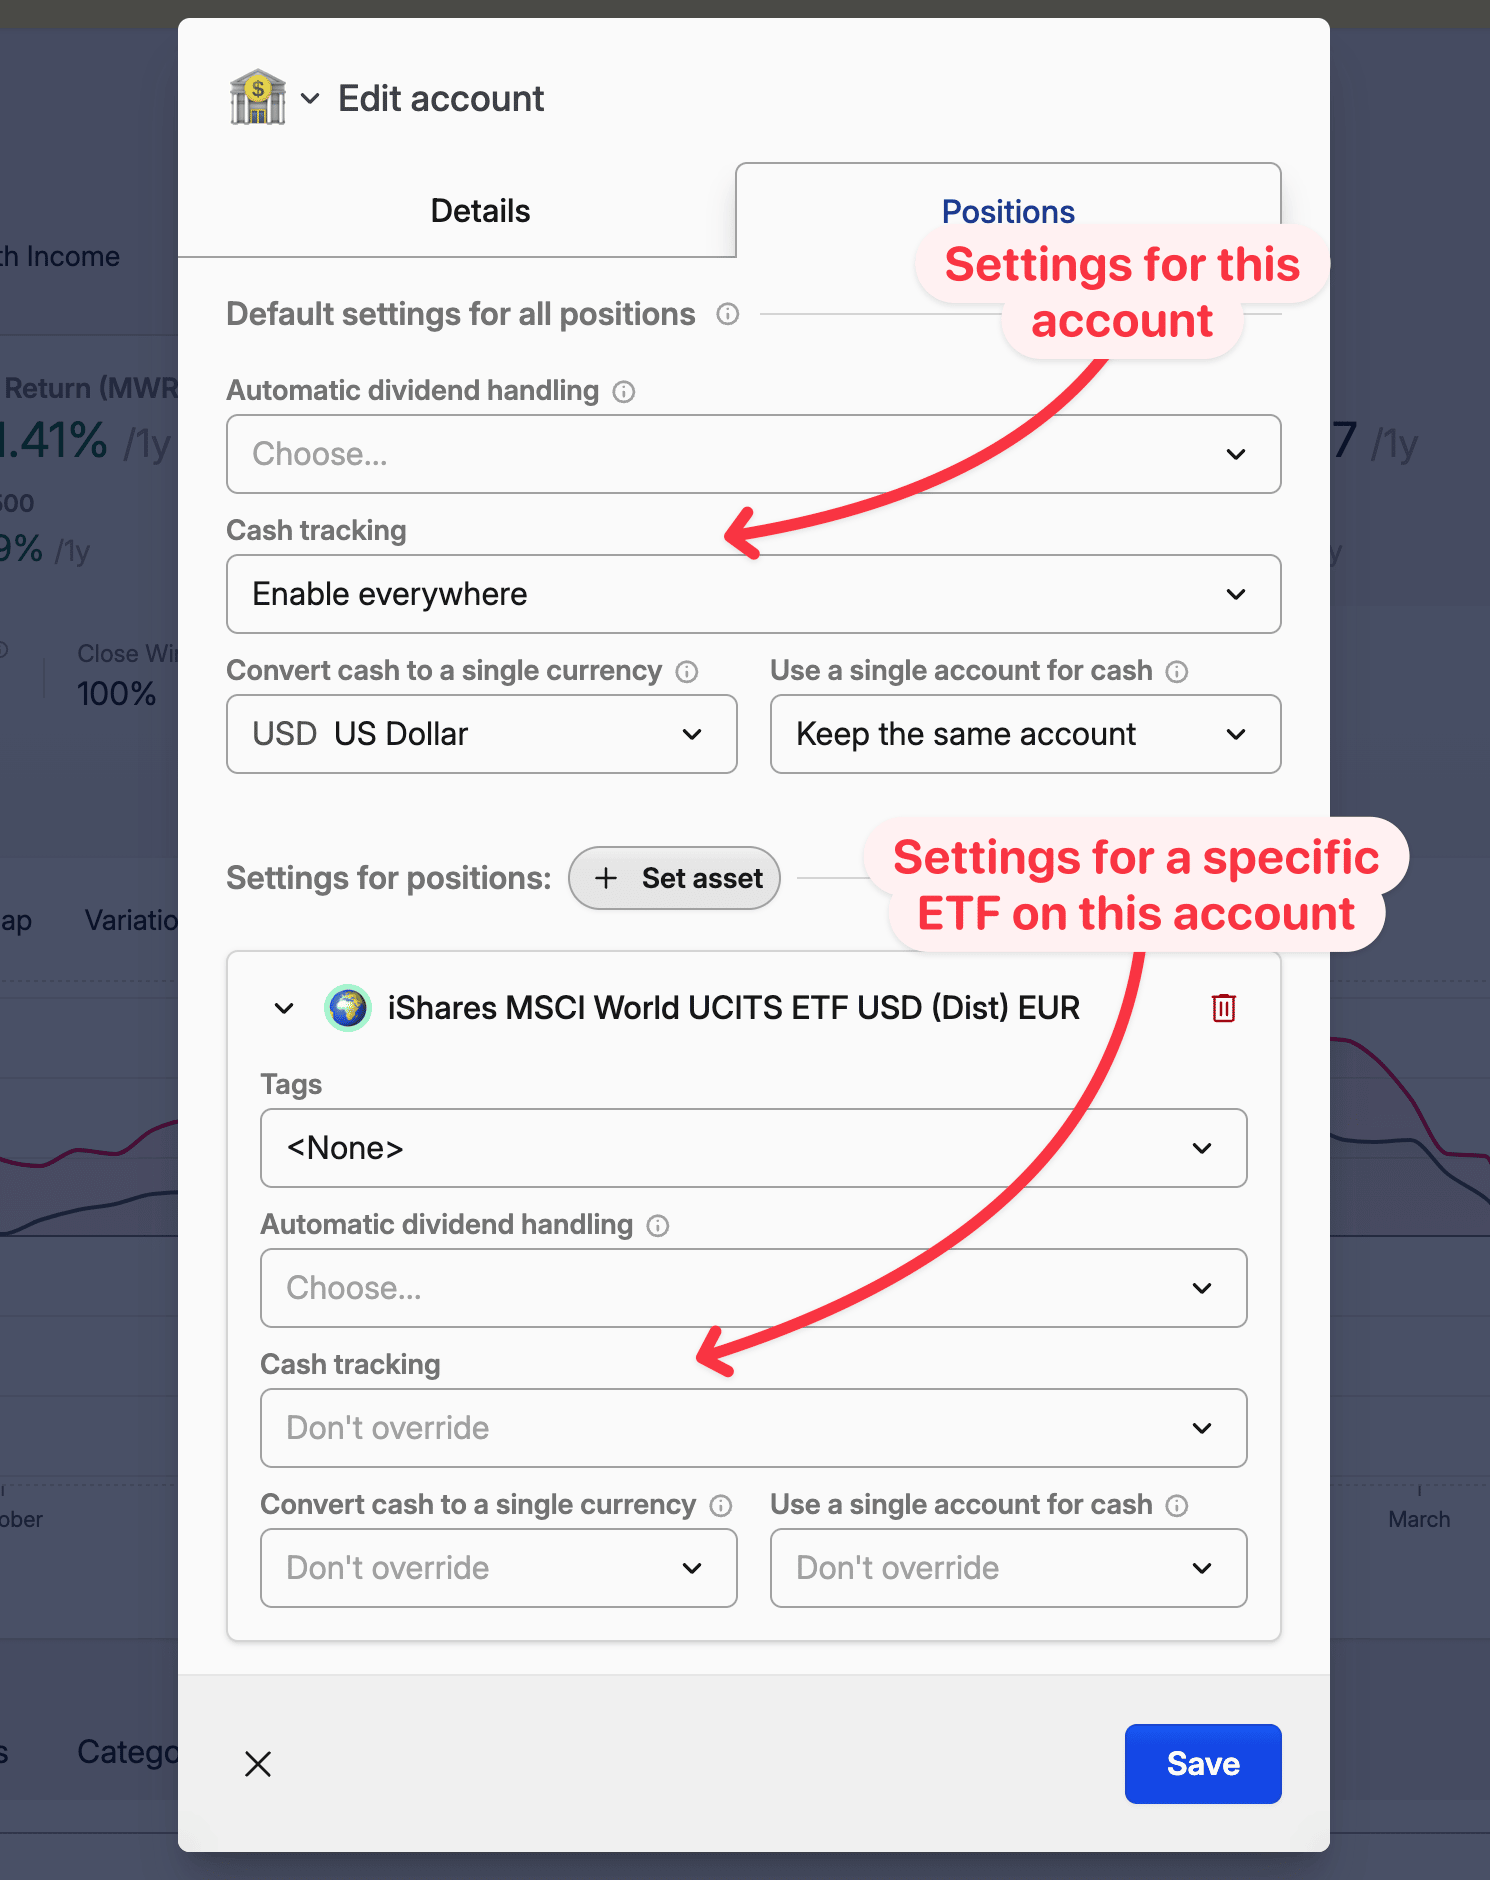
Importing history
Most of our import presets will now automatically import cash deposits, withdrawals, and transfers once cash tracking is enabled.
If you have an existing project, you can re-import your transaction history. Your existing transactions will remain untouched, and only the new cash transactions will be added. If you've been using account balance transactions to track cash, you can leave them as they are.
For Trading 212, Coinbase, IBKR, Degiro and Tasty Trade, it's best to remove transactions and import again, or verify the list of transactions to be imported, as the importers where updated for improved accuracy.
Important Changes for Trading 212 and Coinbase:
To support the new cash tracking feature, we've updated the import presets for Trading 212 and Coinbase:
- Trading 212: All transactions will now be converted to your account's currency, reflecting how this broker operates.
- Coinbase: Transactions will now be imported in their actual transaction currency (used to be account currency).
When importing historical data fromTrading 212 or Coinbase, these changes may lead to duplicate transactions. Please review your imports carefully.
A new transaction type is now available - Convert / Move - designed to handle asset transformations and transfers while maintaining accurate portfolio tracking.
When to use Convert / Move:
Ticker changes - When a company changes its trading symbol
Corporate actions - Mergers, spin-offs, and reorganizations
Crypto migrations - Token swaps or blockchain upgrades
Broker-to-broker transfers - Moving positions between accounts without selling
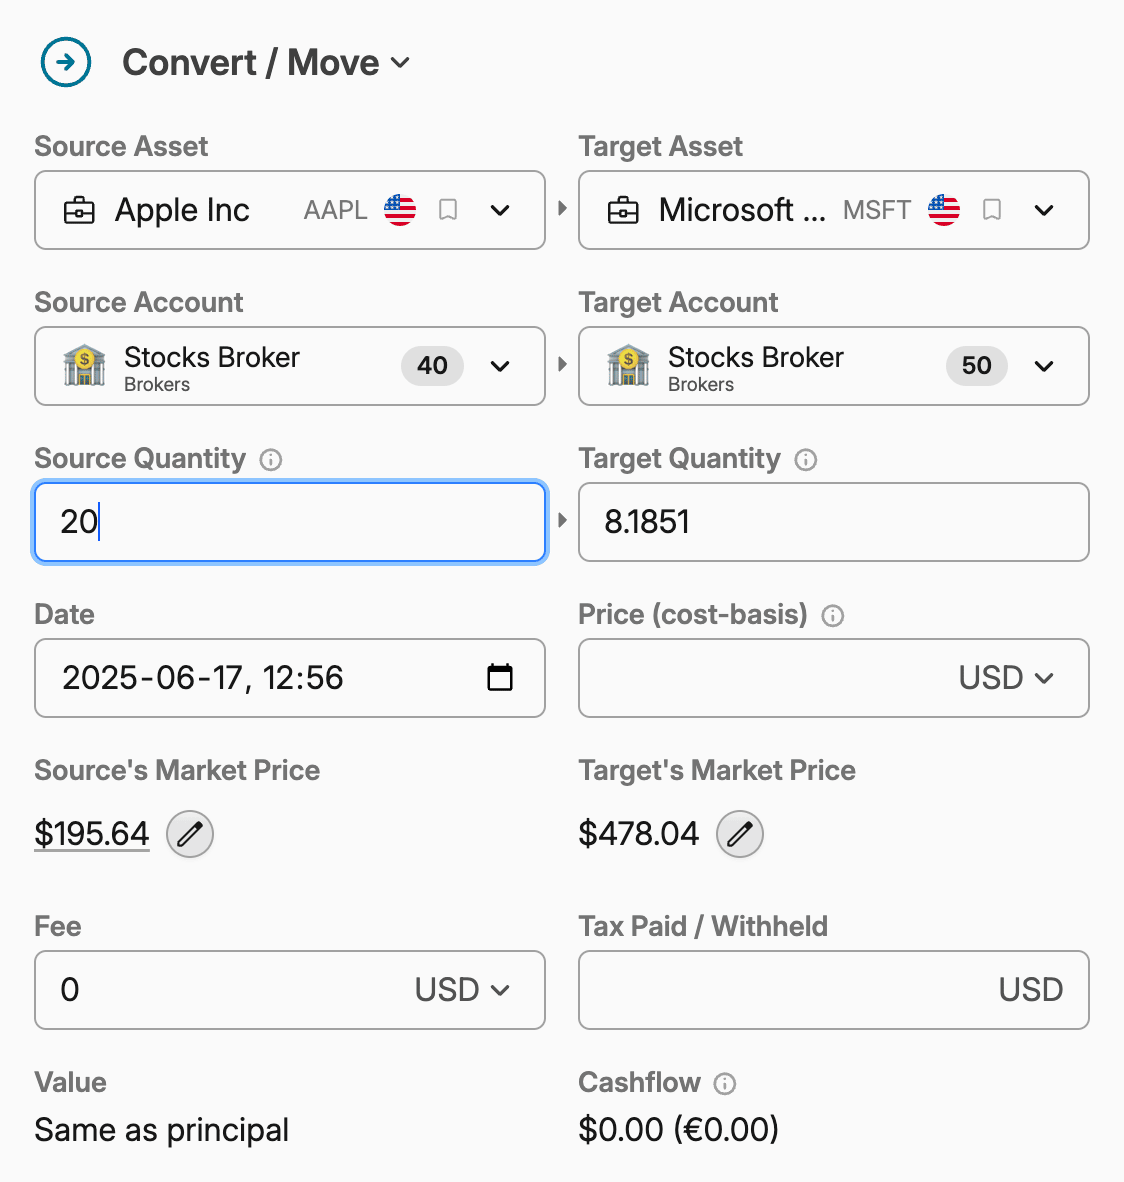
While you can use Convert for currency conversions, we recommend using the Buy transaction type for cash conversions instead for cleaner tracking. Especially as cash tracking is already in Early Access.
How it works:
The Convert transaction preserves your investment history by forwarding the original position's cost basis to the new position. This means:
✅ No realized gains or losses on conversion
✅ Continuous performance tracking across both assets
✅ Accurate long-term returns
Of course, you can always set a fixed cost-basis, that will be used to properly calculate returns and possible tax obligations.
🦉 Note on return rates: Individual positions may show sudden profit/loss changes on the conversion date (the source position transfers all its gains/losses, while the new position inherits them). However, when viewing both assets together, your returns remain continuous and accurate.
Fetch market prices in imports
You can now fetch and use market prices in imports! Just add a Fetch Market Price statement, configure it with asset, date and optional currency, and use the price value wherever you need by referencing the Fetched Market Price property.
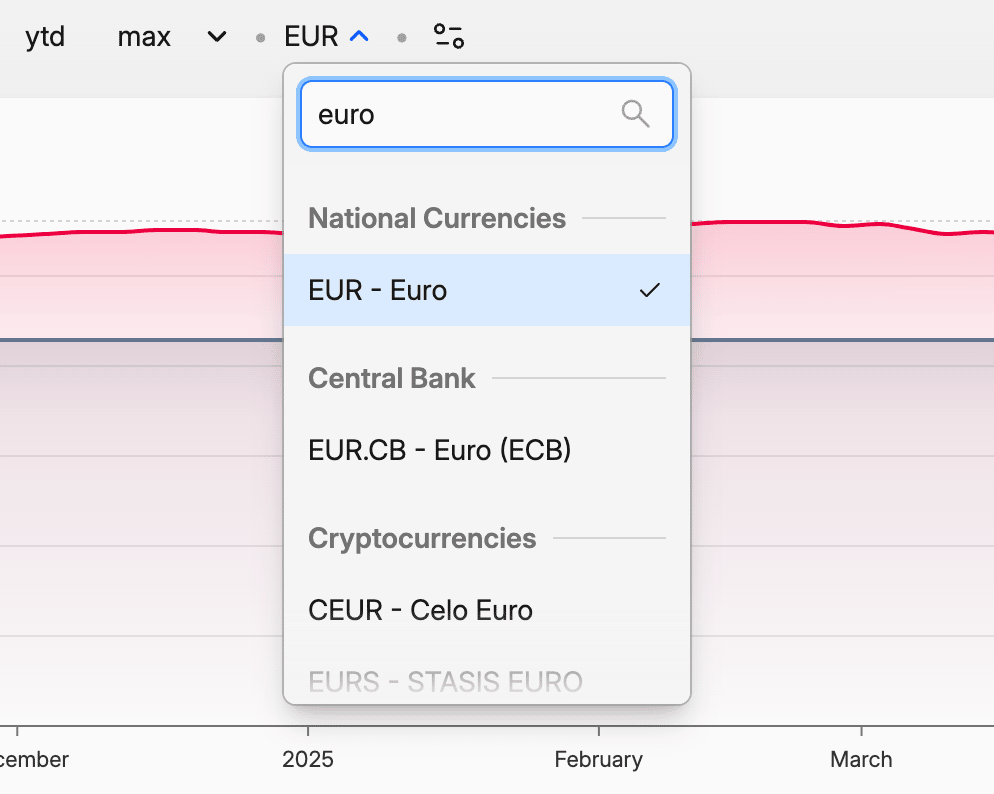
You can now use any cryptocurrency for transaction prices, fees, or to view your portfolio. This includes custom cryptocurrencies you add to your project, even when priced manually - the only requirement is that they have a symbol.
Since there are many cryptocurrencies available, all currencies are now properly grouped when you search for them.
As cash tracking is rapidly approaching, cash positions are treated differently from other assets to improve performance on large projects. Going forward, cash assets will not support transaction lots, transaction tags, or tax on sales. However, taxes on Interest and Other transactions will continue to be applied as usual.
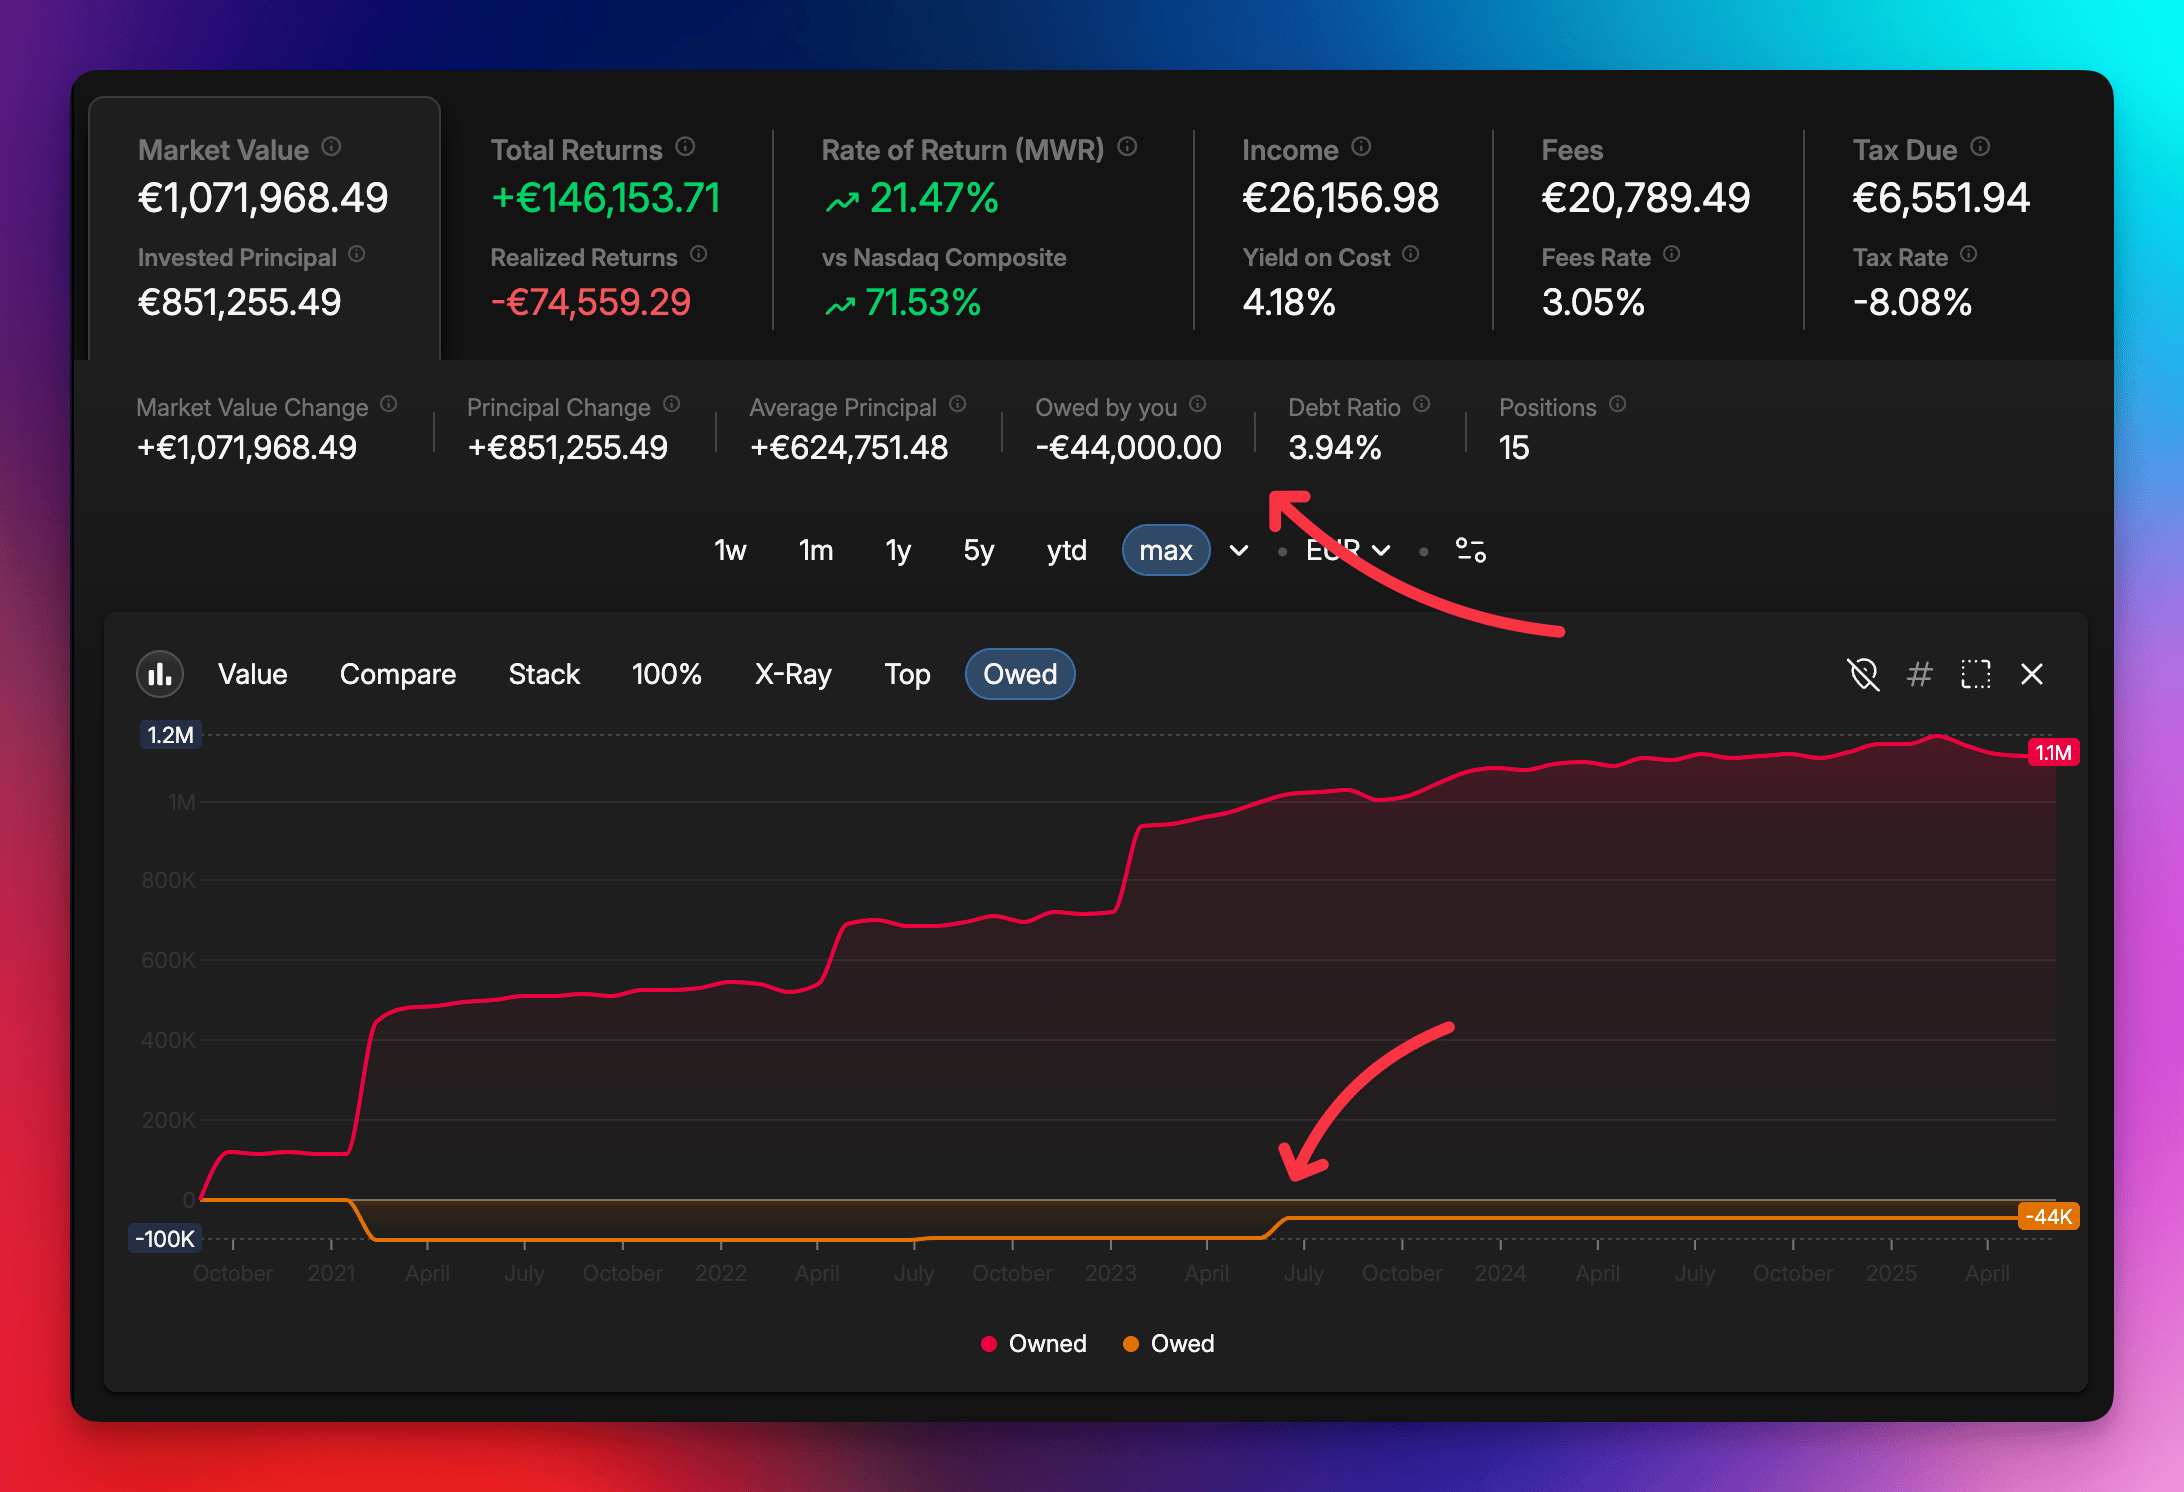
After weeks of rewriting underlying components of our performance calculation engine, we're proud to present the first feature built on top of it - liabilities!
There are two new asset types - Loan and Mortgage, but generally any asset can be a liability by having a negative balance. You can choose one of the following:
Buy with a negative quantity (and then sell with negative quantity to close it),
Sell before you Buy (a.k.a. Short sell),
Set a negative balance with Account Balance.
You can also sell more than you own and vice versa - account balances of any asset can simply go both ways.
To control that, there are three new metrics: Owned, Owed and Debt Ratio. You can filter out positions with any debt, or just the units when position went under water (or above). Finally, there's an Owed chart under Market Value which shows both sides at the same time.
There's more!
Big projects should now be more responsive (as calculations can be up to 6x faster now).
There are two new filters that match the whole position - Position is opened and Position has income. Their old counterparts that match at the unit/lot level are now Unit closed date and Unit has Transaction Type.
Interest and Rent value can now be negative (both to capture negative interest on a loan, or interest corrections).
ROI and Fees Rate should capture fees and taxes more accurately, especially on negative positions.
Returns Attribution should now be more accurate.
Dark/Light theme switch in the top-right menu.
We've been quite busy improving Capitally over the past few weeks!
Dark theme and UI enhancements
The dark theme is finally here! You can enable it in Settings -> Your Profile.
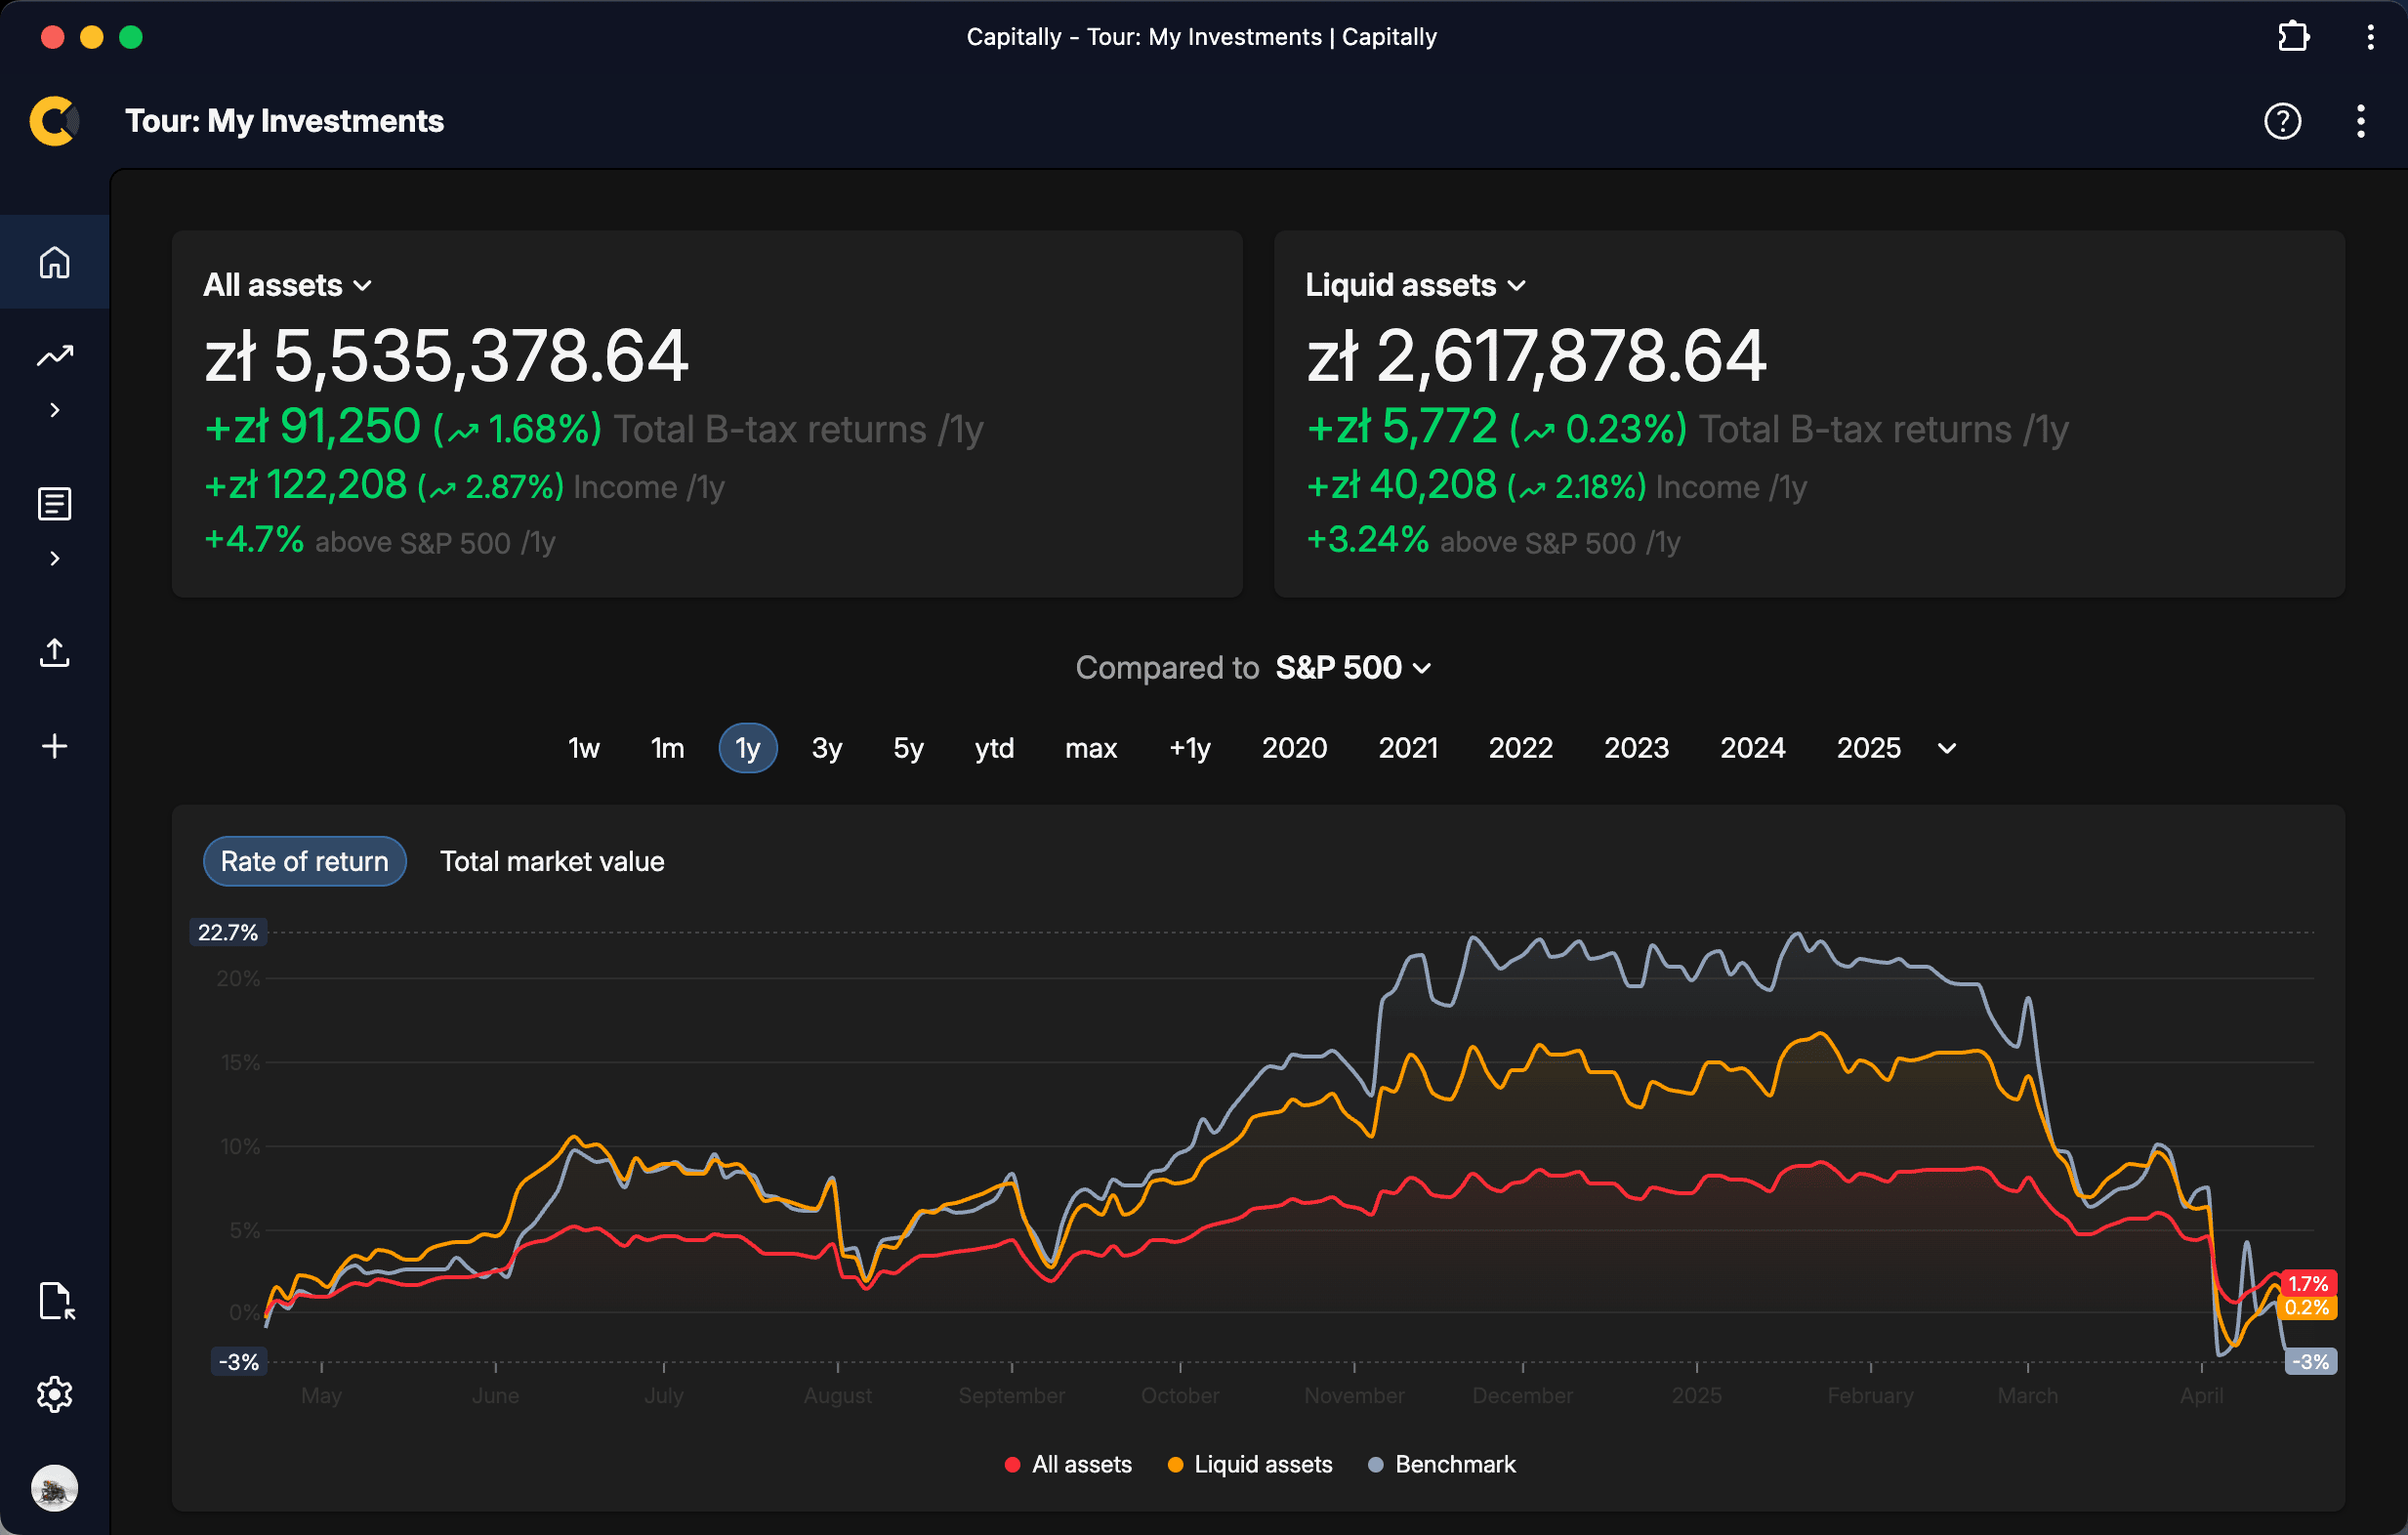
Use a new font throughout, numbers in tables used fixed width font for comparisons updated
Improved text contrast
Improved UX of modals and selects
Pie charts don't display empty series anymore
Enhanced Tax Reporting
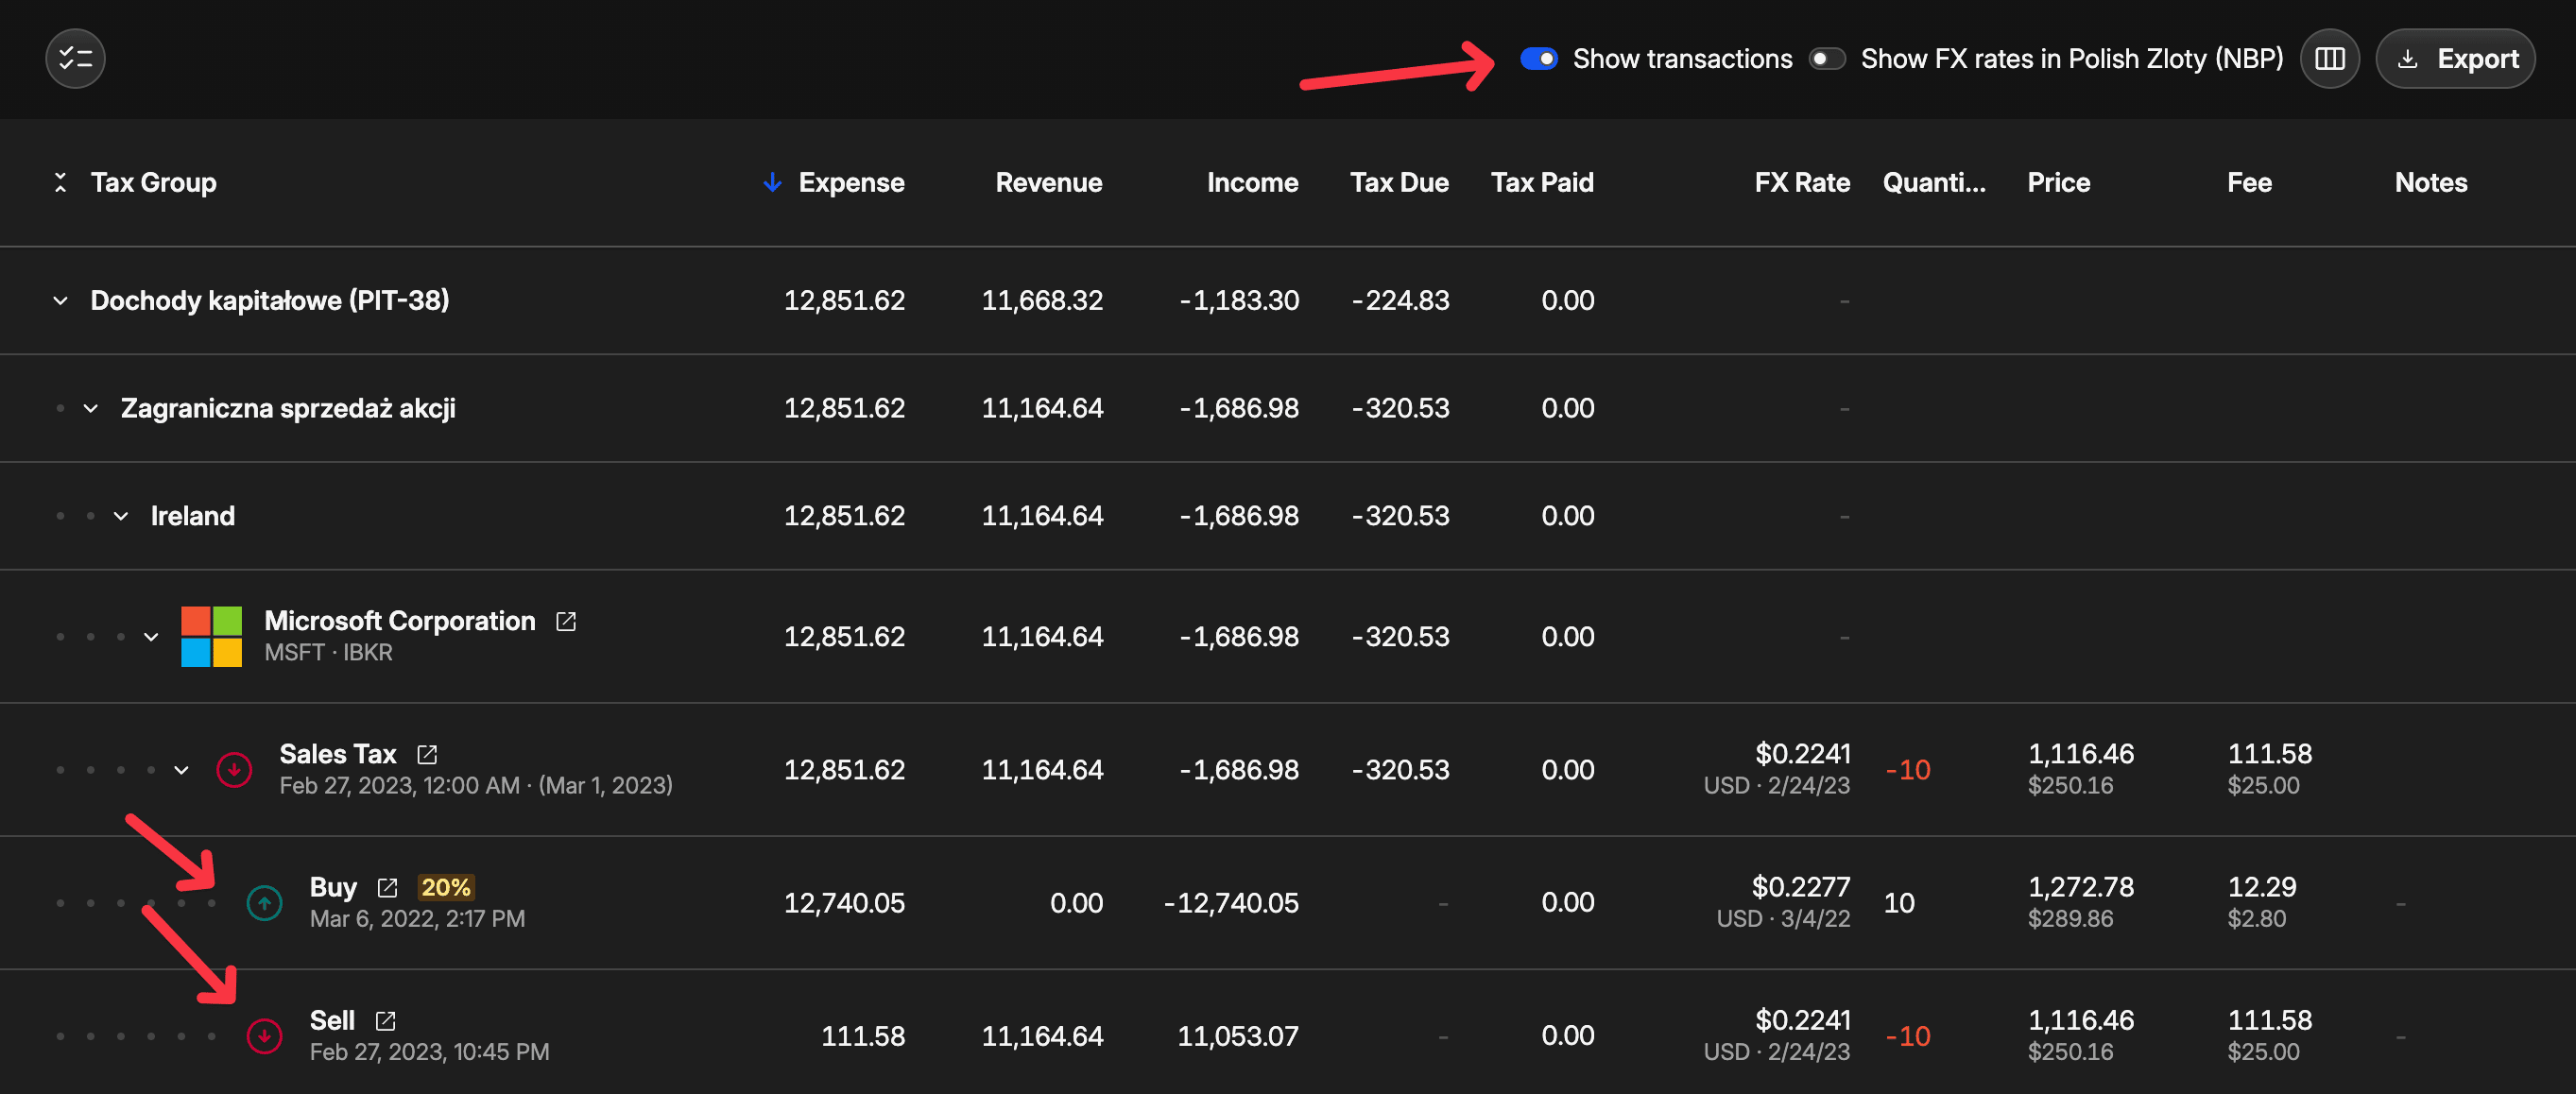
See the details of each transaction that impacts your tax calculations directly within the tax report
See the foreign exchange rate in the original currency - as it's required by the US IRS
Polish Tax Preset includes income tax from interest payments, accounts for other tax events like revenue and fees, and ensures the tax paid/due calculation respects the 19% limit where applicable
Tax calculations now correctly include transactions made today, and lots closed today are accurately shown as closed. We've also fixed issues related to including fees in dividend expenses and handling virtual transactions correctly.
And others...
New charts and metrics - Income 1y yield and Income growth
Improved application sync between desktop and mobile - your data should sync properly whenever you open the app
Improved sorting of market symbols when searching
Improved handling of delisted assets to prevent unnecessary data fetching errors and warnings
Updated import presets for Firstrade, IBKR, Selfbank and XTB
With version 2.0, we're marking an important milestone in Capitally's growth after listening closely to your feedback and adding many useful features over the past year. 🥳
We're also replacing our Founders Plan with new tiered pricing options - Sailor and Navigator.
Both plans have the same features - they only differ in how many assets you can track. This way, whether you run a smaller portfolio or manage a larger one, there's a perfect package just for you.
All prices will show in Euro, US Dollar, or Polish Złoty based on where you live. The price you see is exactly what you'll pay throughout your entire subscription - no surprises!
Check out the new pricing page.
p.s. In the meantime, we also fixed a lot of small things and introduced imports for the: Delta, eToro, FXPro, Interactive Investor, Lightyear, Nordnet and Yuh.
Bookmarks are your shortcuts to frequently used views and reports in Capitally. Think of them as your personal navigation system that remembers exactly how you like to see your data.
What makes bookmarks special?
The beauty of bookmarks lies in their flexibility. You can save either complete view settings or just specific parts you care about. For instance, you might want to save just your preferred metric, period, and chart type, while keeping your current filters and groups. When you click such a bookmark, it will only update those specific settings while leaving everything else unchanged.
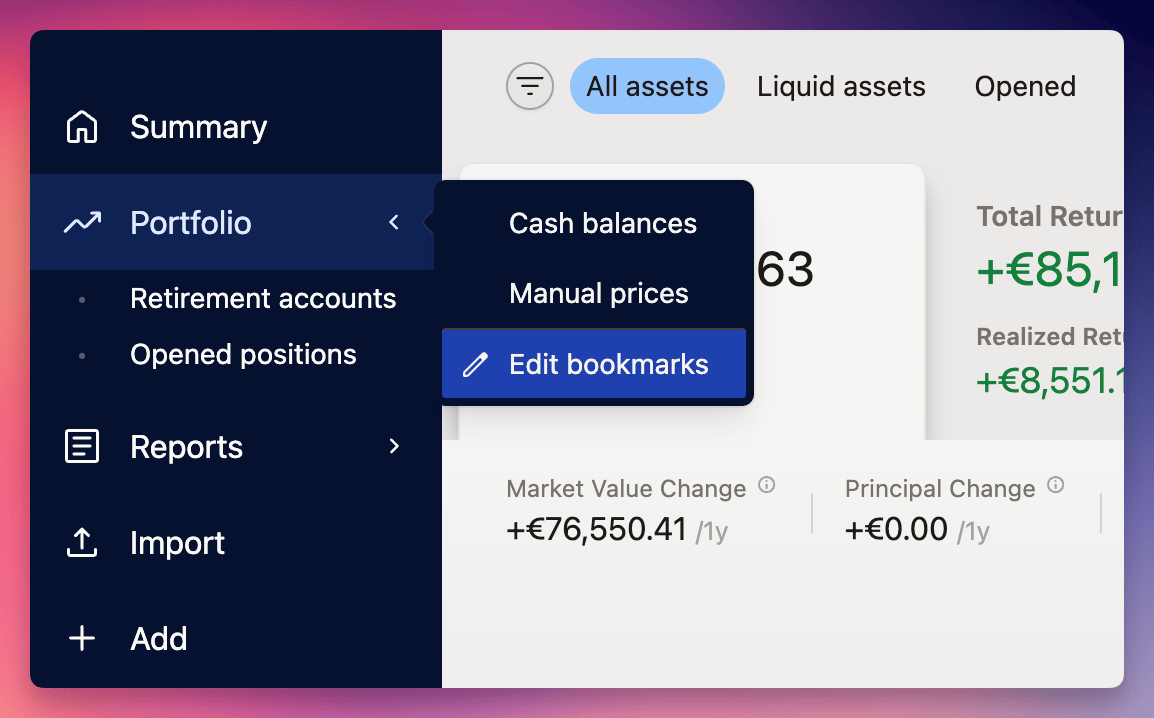
Learn more and give them a try!
You can now review your project's history on the new History page available from the top-right menu.
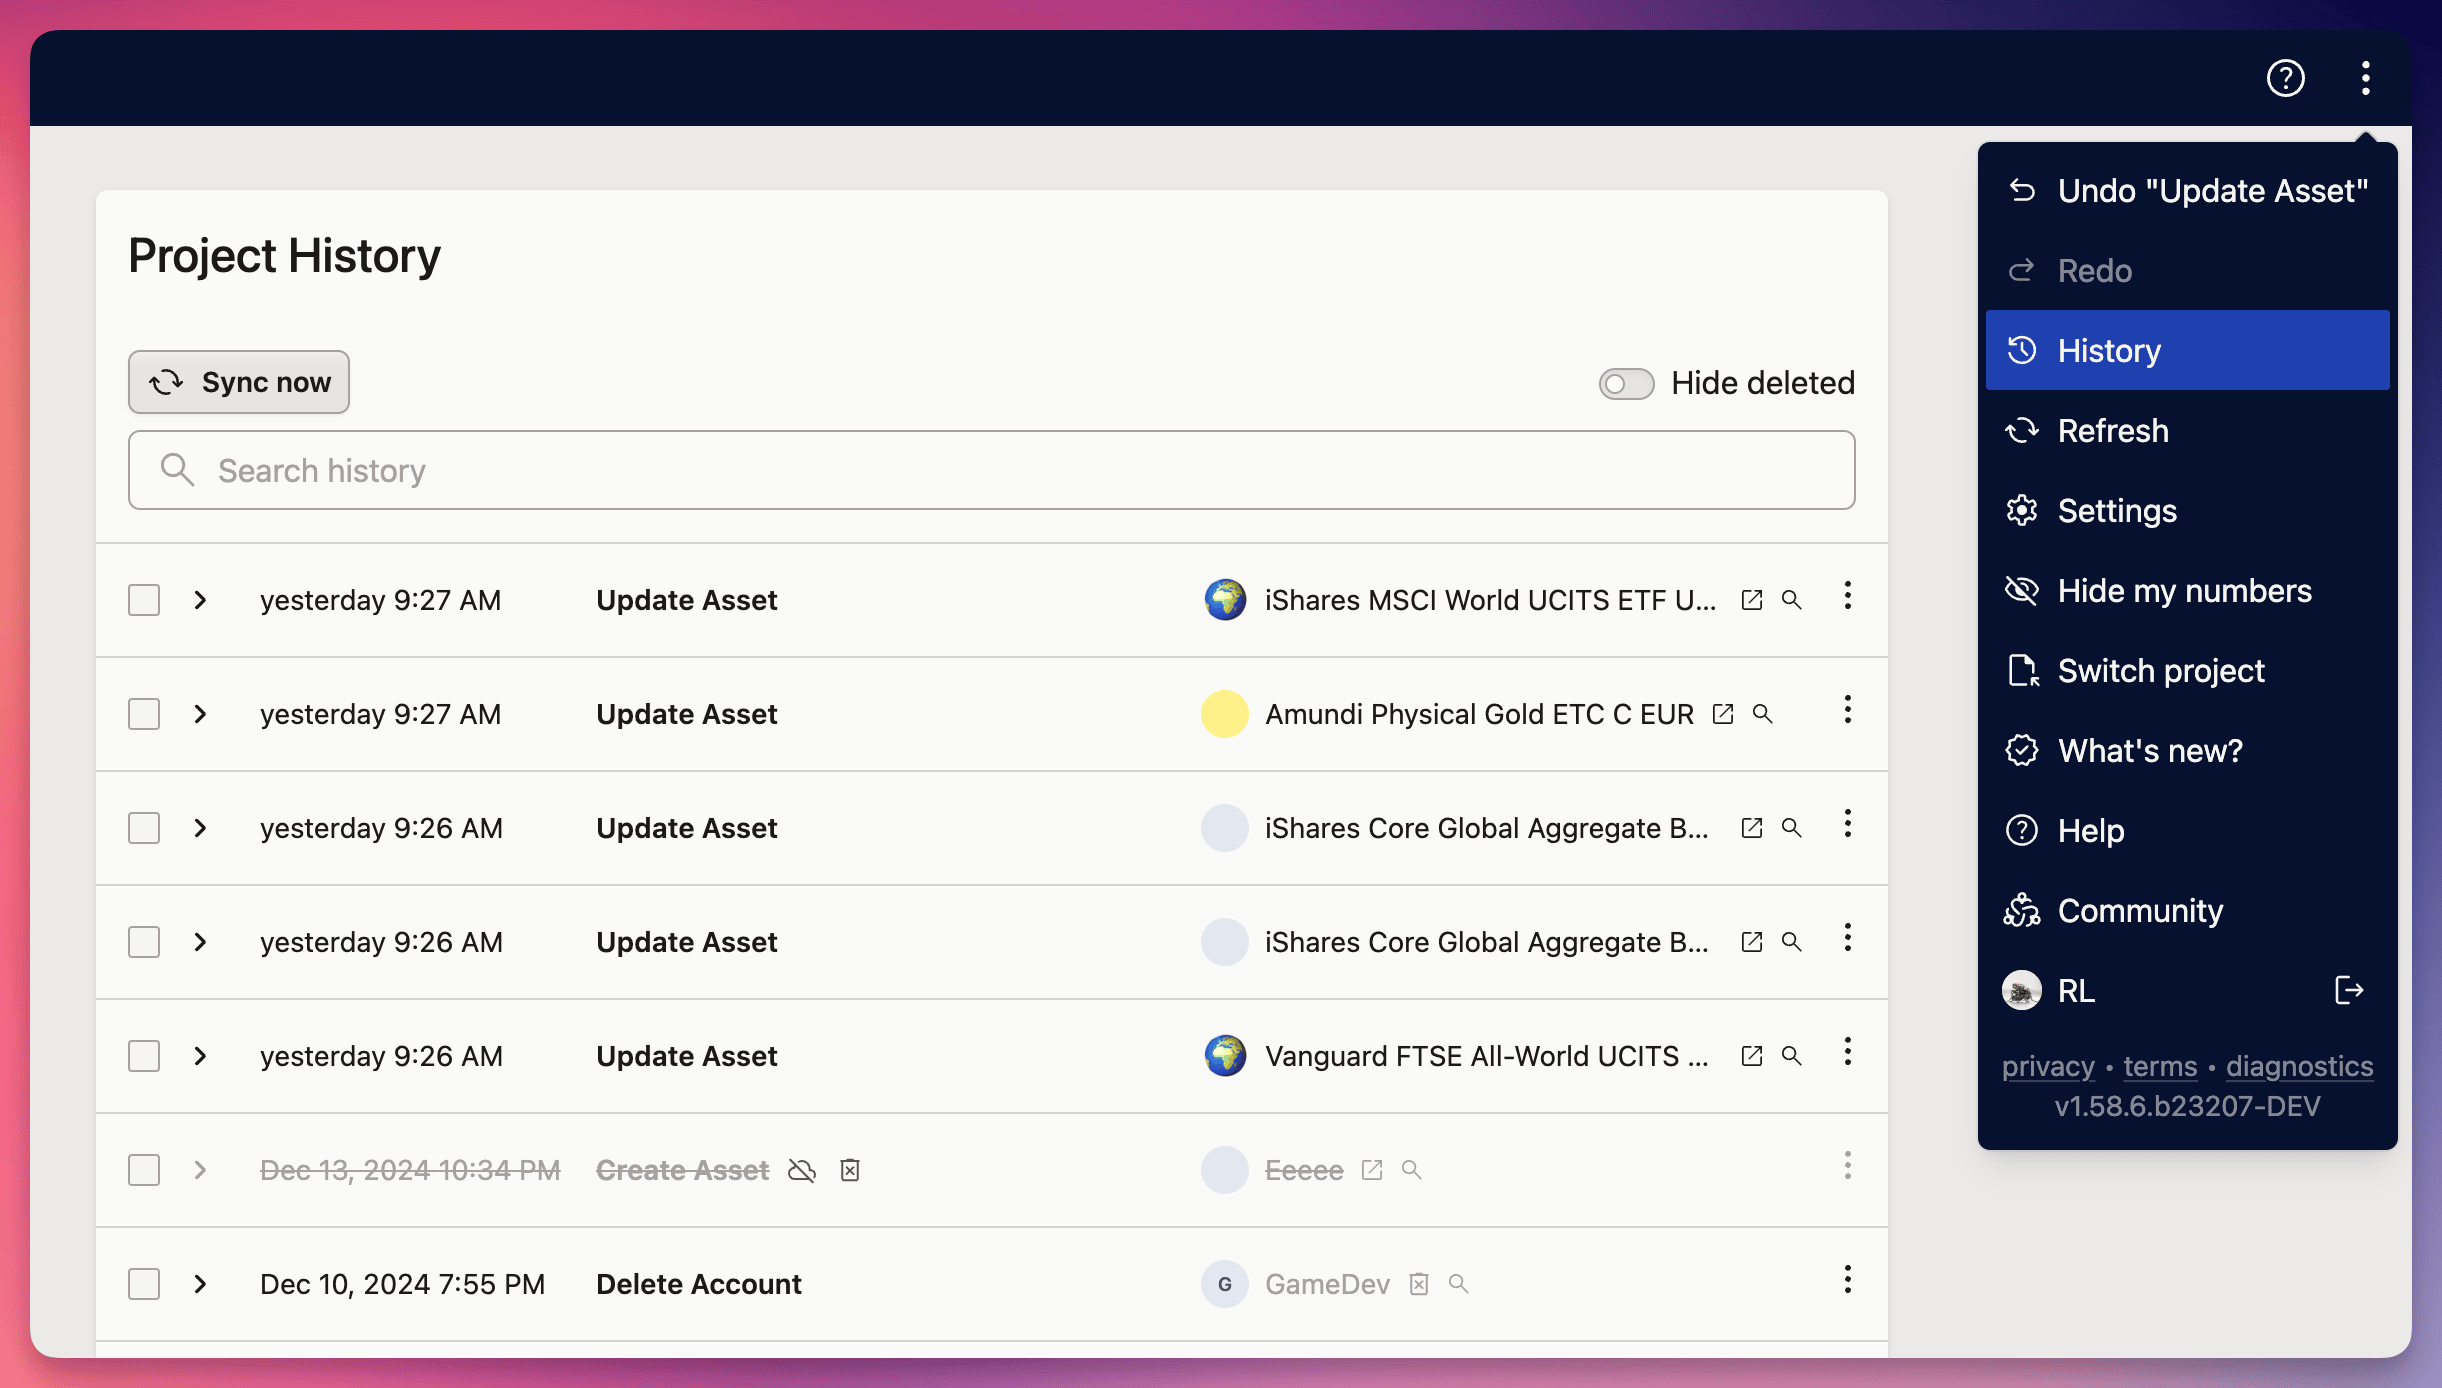 You can do all sorts of things there:
view history of a particular Asset or Transaction - every object now has a History in their context menu, or you can click the loupe in the history
search history to find when a specific value was entered
expand the change to see which properties where modified
revert the whole project to any previous point in time
delete changes you don't need anymore or ones that are causing trouble
export selected changes and import them to another project
Read more on how to use it
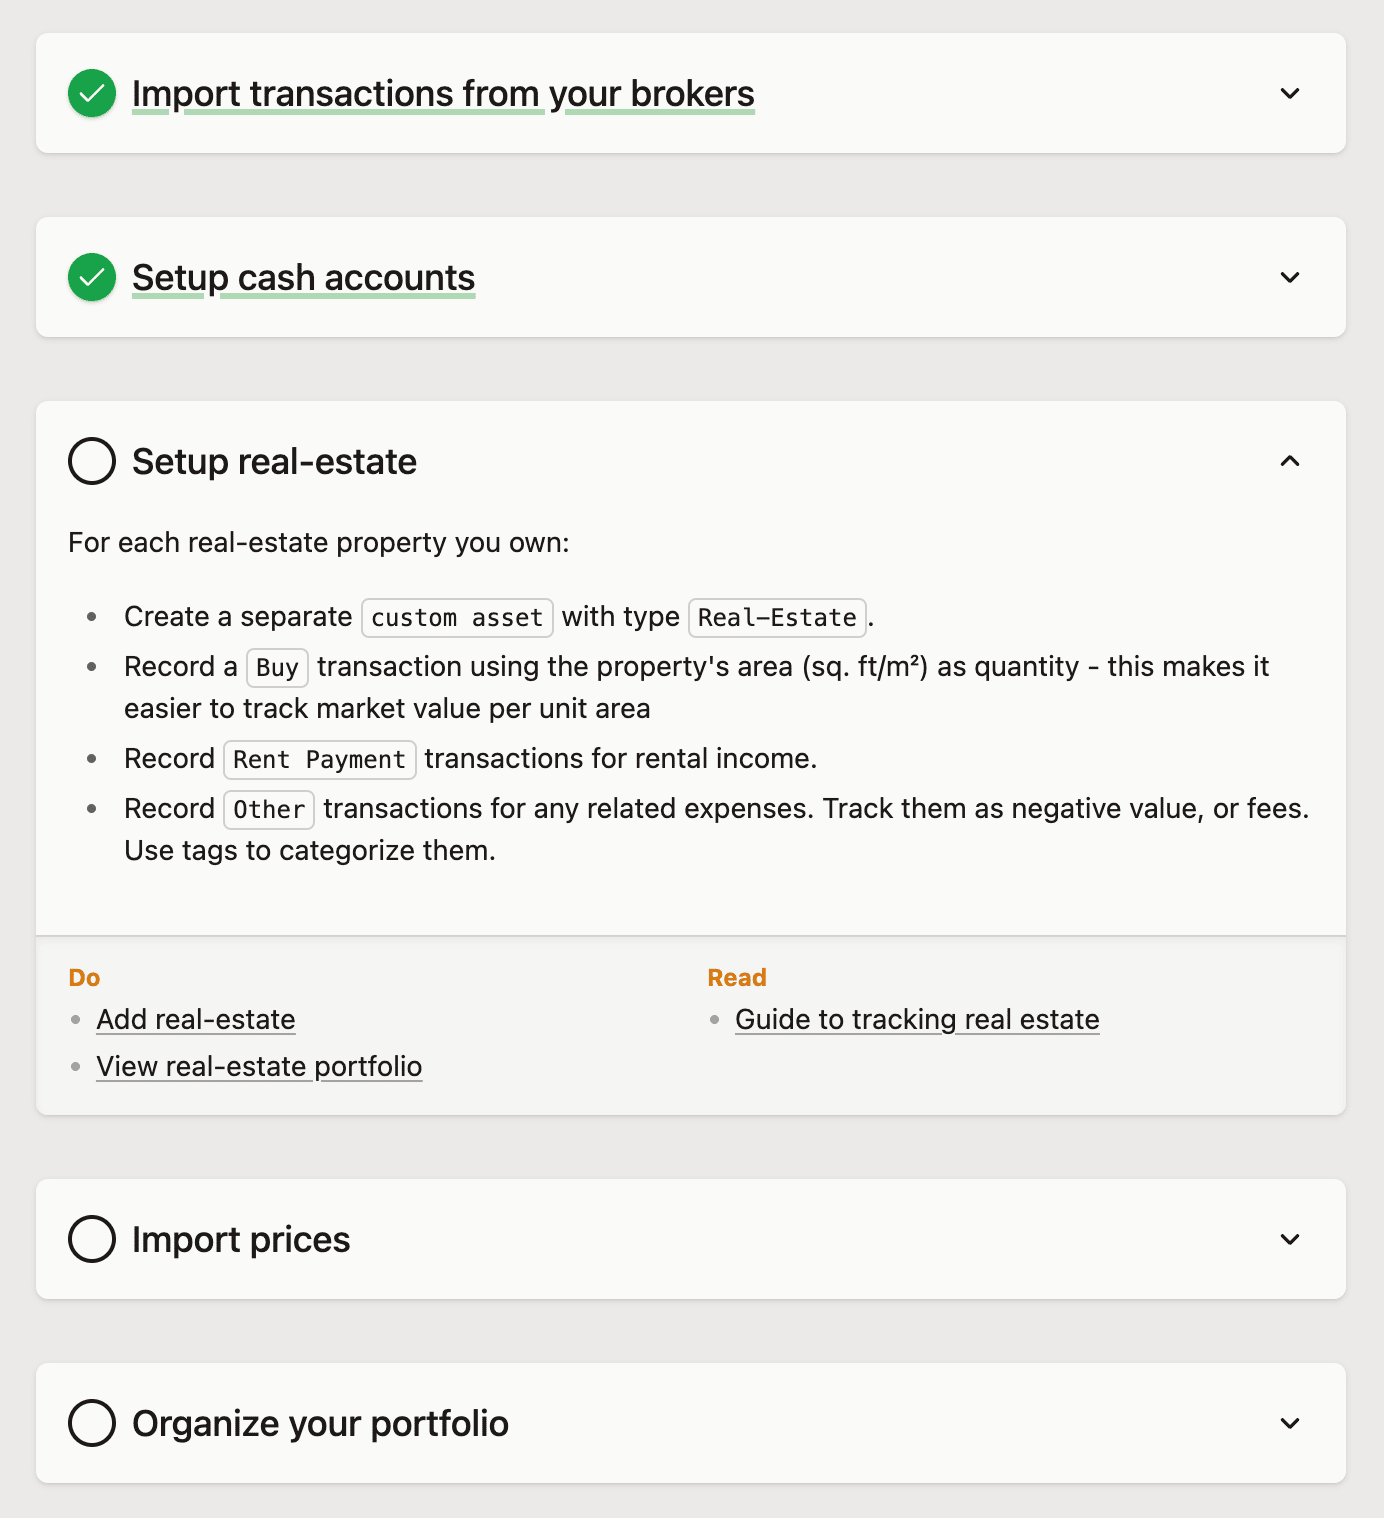
A new onboarding experience is now available to everyone with a bunch of improvements designed to help you quickly add or fix you data in Capitally.
Onboarding tasks
If you create a new project, or click Start onboarding again in Settings, you will get a list of things to do and read, depending on what you plan to track. Try it out, as you might discover a new thing or two. In the short future, we'll add tutorial videos to every section.
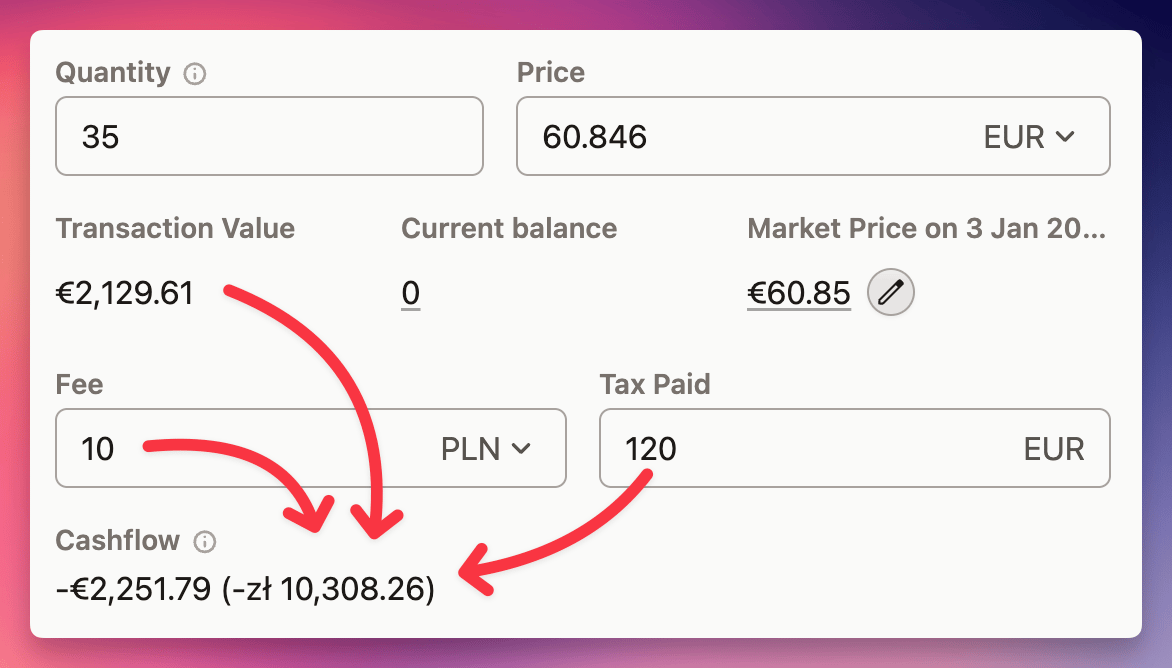
Transaction cashflow preview
Transactions will now display the cashflow they generate, which combines all revenue, expense, fees and taxes into one value - both in the transaction's and project's currencies.
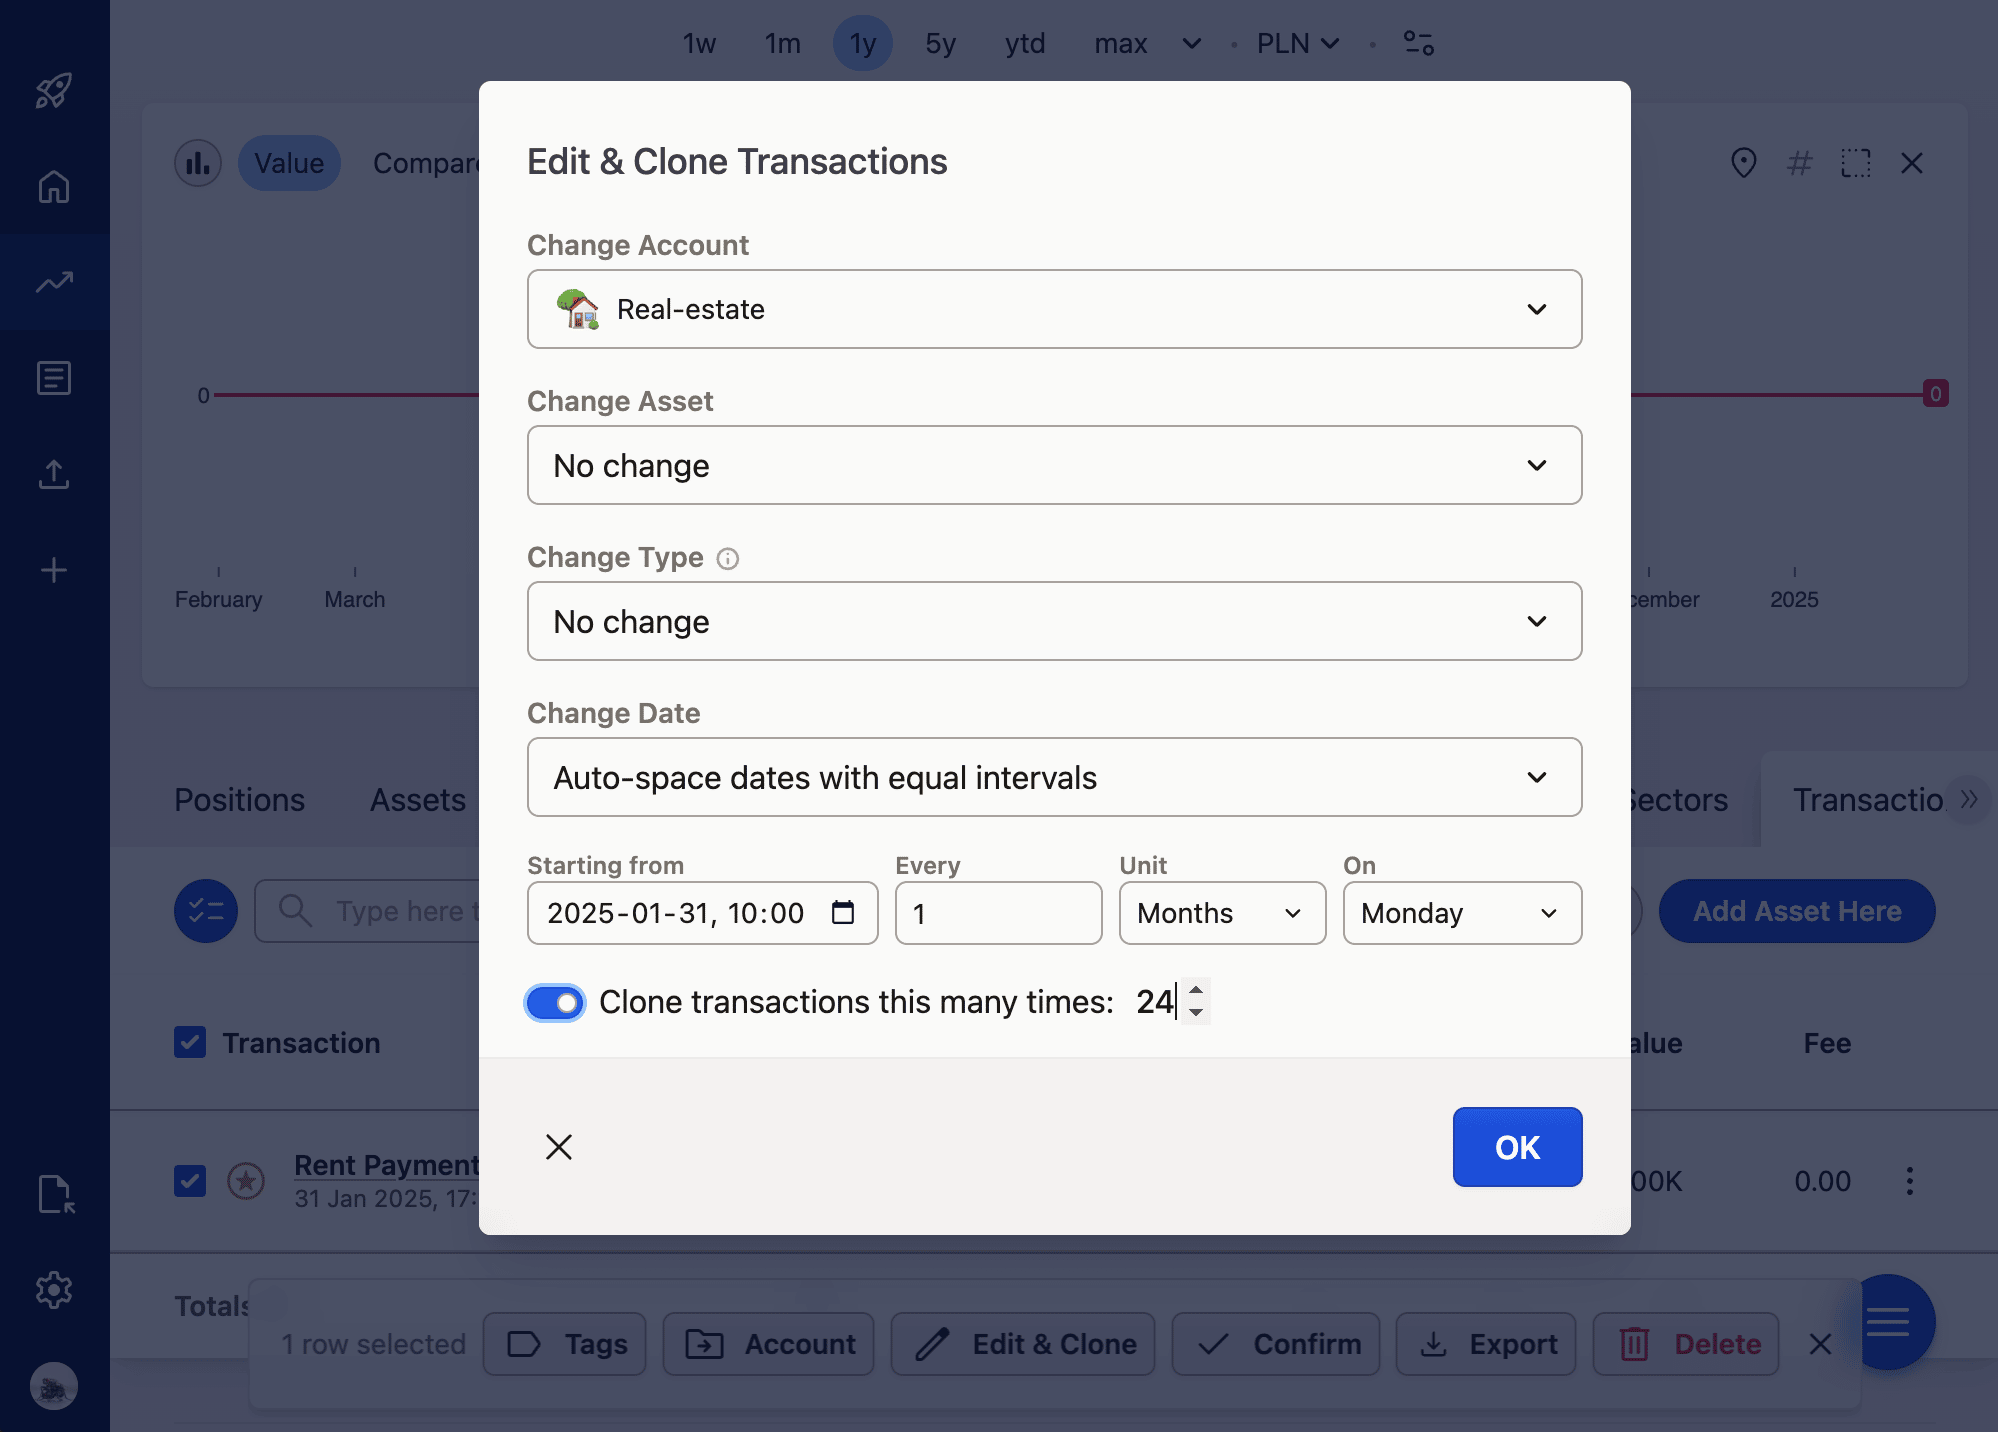
Batch editing Transactions
You can now quickly change Account, Asset, Type or Date on multiple transactions at once. Moreover, you can clone them multiple times and space around their dates, so you can quickly create recurring transactions, like rental payments!
And more
You can quickly clone an Asset or Transaction by clicking on it's context menu and choosing
Clone.You can quickly enable the selection mode by hovering on the name - a faint checkbox will appear on the left - clicking it will select the row and turn selection mode on.
Account Folders can now be used as Benchmarks.
It's a bit quicker to create custom assets, as you can set their currency straight from the first tab, and the Prices tab is no longer opened automatically.
Dropdowns won't display on-screen keyboard on mobile devices, so it's easier to choose from existing options. Just click the search box to activate it as usual.
The last couple of versions where mostly big & small maintenance updates, and improvements to imports.
The feature currently under development is the new onboarding experience which will be available under Early Access soon to get some feedback.
New Import Presets
TD Waterhouse Canada
Freedom 24
PKO TFI (Pension funds)
Esaliens 24 (Polish pension funds)
inPZU (Polish pension funds)
Goldman Sachs (Polish pension funds)
Updated Import Presets
IBKR: Accept Trade Confirmation flex queries - for same-day transaction imports
Bossa: Accept exports from the new WebTrader interface
MDM: Import operations (dividends, fees, etc.)
XTB: Handle CFD transactions, like dividend equivalents, swaps & spin-offs
As the tax season is approaching, this update contains a lot of improvements around tax calculations.
Taxes can take Settlement dates into account
Currency rate offsets can take Settlement dates into account
Currency rate offsets and Settlement dates take national holidays into account
Option to specify first month of a year ( 👋 🇦🇺 )
Improve Tax Report & Settings UI
When cloning or deleting a tax preset, ask to reassign accounts
Tax events are applied in date order across all positions
Taxes Due report visual improvements
Transfer and Account Balance transactions don't create tax events (and are therefore not taxed)
Fix not all transactions displayed for a tax event
Add Settled Date column to Taxable Income Report
Allow presets to dynamically switch between tax periods
Fix Tax Due in Taxes Due report not using the currency offset
Tax Presets
PL: Two versions to choose from - D-1 and D+1 (using Settlement dates)
PL: Ignore crypto-crypto transactions
PL: Proper crypto tax support
Bug Fixes
Always default to asset currency in transaction's value & fee
imports: Make Transaction/Asset/Account prop names unique
Dates are exported in a format supported by Excel/Spreadsheets/Numbers (yyyy-mm-dd HH:MM)
Import presets
Hargreaves Lansdown: new ✨
Portu: new ✨
Bossa: Creates custom corporate bond assets
Portfolio Performance: Handle French export
Every day, dozens of market symbols get renamed, delisted or even removed by our data provider. This may sometimes affect your portfolios, with warnings and errors that not everybody know what to do with.
From this version it should be much better as:
Renamed
Renamed symbols are automatically detected by us - you don't need to do anything on your side. They will remain on the old symbol, but pricing data will be fetched from the new one
Delisted
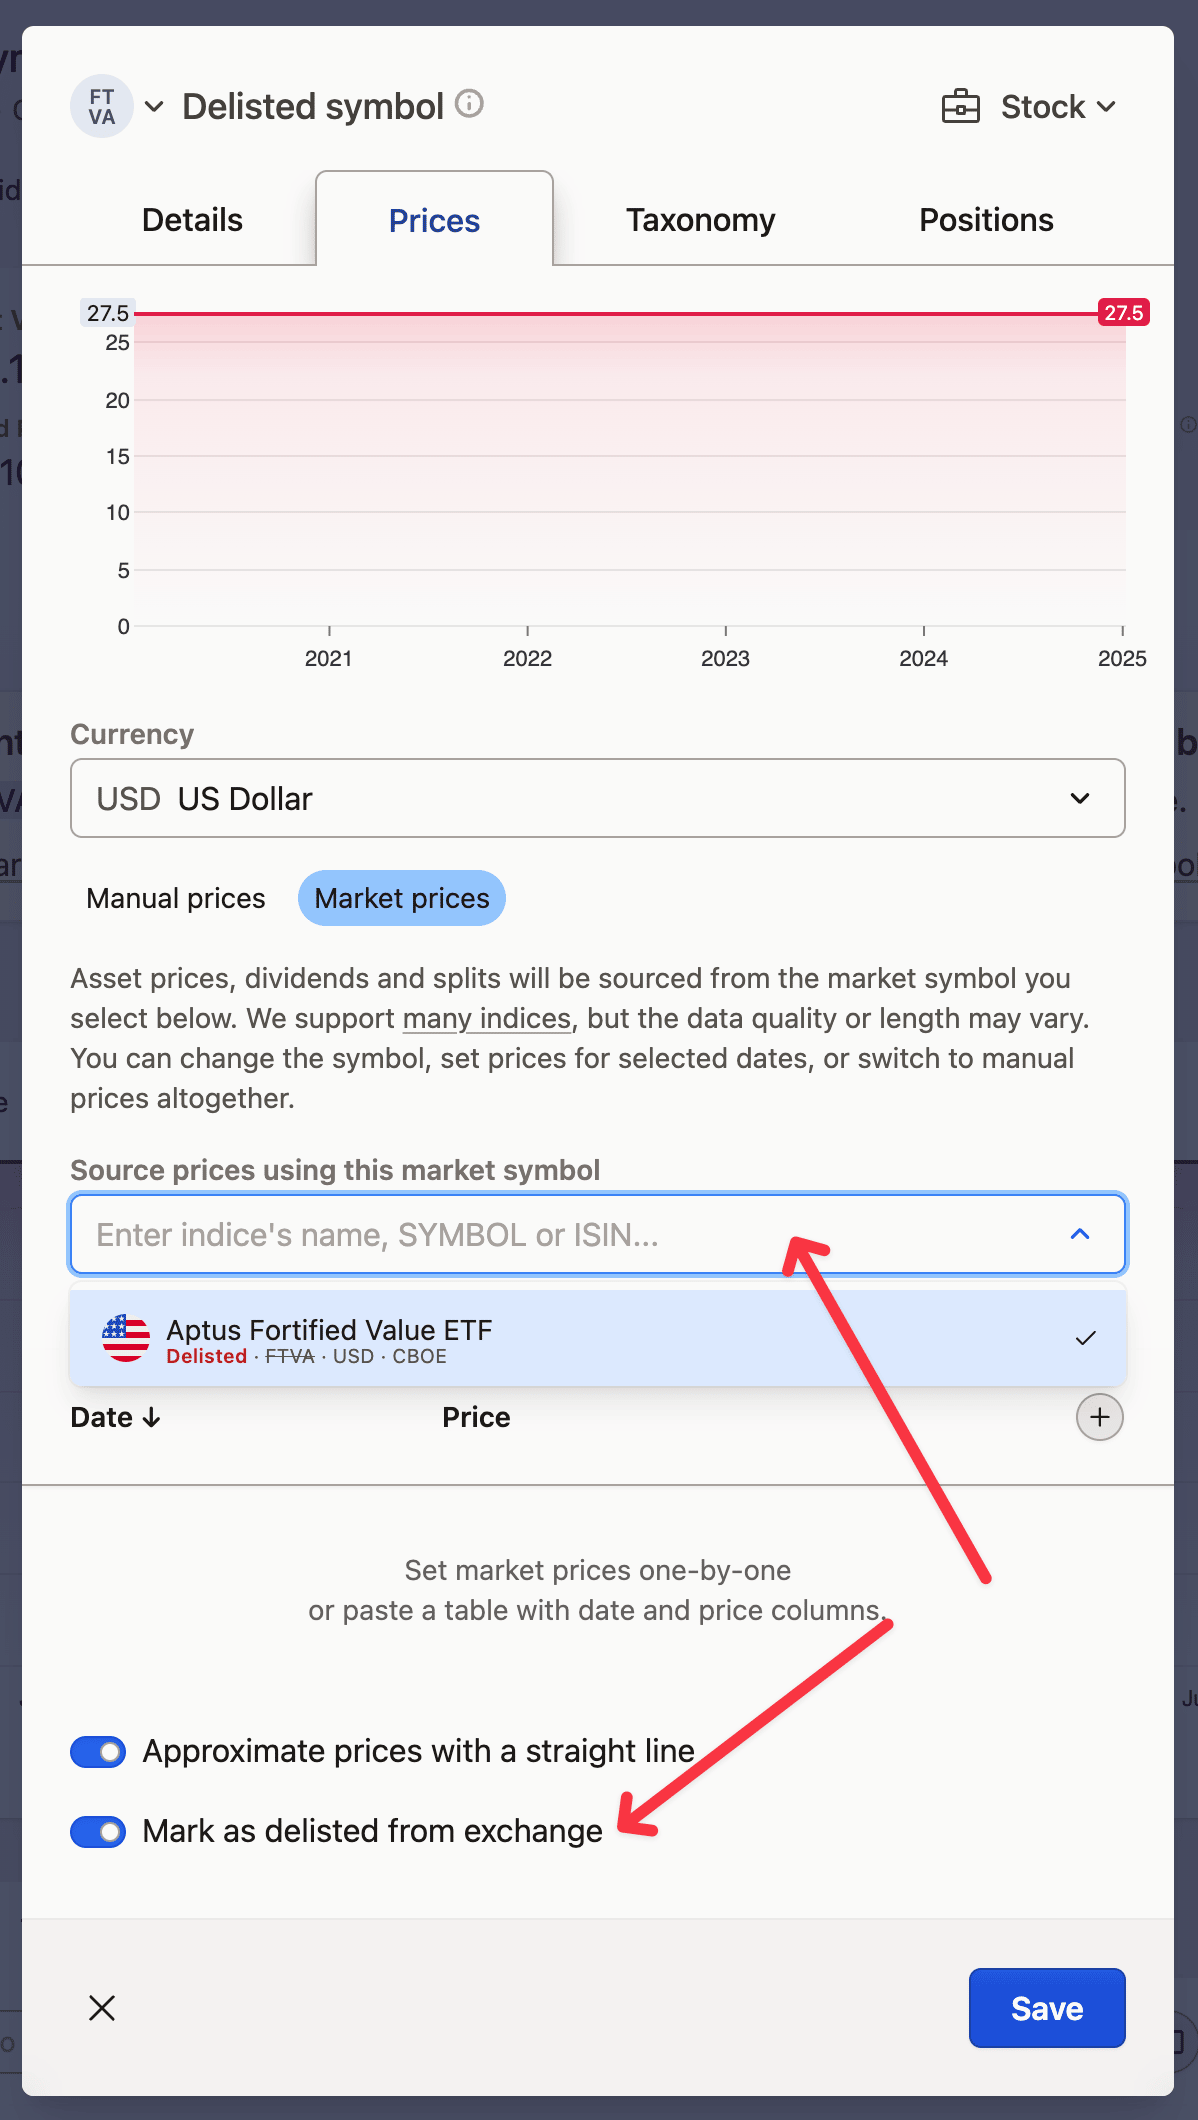
If a symbol is delisted, we'll show a warning like this:
 You can either mark the asset as delisted in the Prices tab or switch to another exchange for pricing data where that symbol is still listed.
Removed
Sometimes our data provider can remove a market symbol for various reasons. Previously, you'd receive a cryptic 404 error. From now on, we'll display this warning:
 To fix this, you can switch to another symbol on the same or different exchange. Or you can switch to manual pricing, especially if it's an old symbol you don't own anymore (you don't need to provide the full history - Buy & Sell transaction prices are enough to calculate proper returns).
If you're sure this symbol should still exist and there's no alternative on a bigger exchange, please let us know and we'll work with the data provider to fix that.
During the past few weeks, a lot of small and big improvements have been made to handling of market prices and importing new data. If you had issues with any of these, you might want to try again 😃
End-of-Day prices handling has been vastly improved, hopefully alleviating issues with prices being different for the first 48 hours after close
Fixed some dividends being reported in a wrong currency (they always assumed the asset's currency which is not always the case)
You can choose which emails you want to receive in Settings -> Privacy
Transaction notes are now searchable
You can now use
Adjusted Pricemetric on a chart (default asset price is unadjusted)You can choose Italian, French, Portuguese, and Spanish locales for numbers and dates
New and improved import templates for Degiro, Exante, Bossa, Firstrade, Santander, Fidelity, Robinhood, Trading 212, Schwab, and eMakler.
In Poland, there's a children's game where you answer "Tomato" to every single question you get, and if you laugh - you lose. As adults, we've adopted this concept and often answer "Tomato" whenever we don't want to give a proper response.
Now you can apply this same idea in Capitally when you want to share your portfolio but prefer not to reveal the actual numbers.
Simply click Hide my numbers in the top-right menu, and a lovely, ripe tomato will replace all numerical values on your screen. Only percentages, market prices, and transaction prices remain visible.

After many weeks of hard work (and a lot of your helpful feedback), the new importing experience is finally here for everyone!
Here’s what’s new since the last update:
Easier Importing: Importing custom data is now even simpler. The whole flow is streamlined, and instead of overwhelming you with the full power and might of the preset editor, you can just quickly confirm the columns we found and be good to go.
The full power and might is still available under Switch to Advanced Mode
Better Symbol Search: Asset symbols are now ordered better by relevance, plus you can narrow down the markets to search in. First markets you select will be treated as your primary choice and sorted higher.
JSON & XML Support: You can now import JSON and XML files. You can even import accounts, assets and transactions in one go using Sections.
Transaction Order: Imported transactions will now keep the order they were created, even if they share the same date. This should help keep things nice and tidy.
And lastly, most presets were fine-tuned a bunch of presets to make your life easier.
We’d love to hear what you think! Give it a try and let us know how it feels. Your feedback has been key in making this update happen, and we’re always listening. 😊
While our new importing system can handle complex data, we know sometimes you just want to add a few transactions quickly. So we've made the process faster and easier than ever:
Open your file
Click
Import any dataCheck if your file loaded correctly
Tell us what type of data you're importing
That's it! We'll do most of the heavy lifting by creating the right preset for your needs and setting up the columns automatically.
All you need to do is take a quick look to make sure everything looks good, and you're done!
If you need more advanced features later, they're still there. We've just made the basic stuff much faster.
It took much longer than anticipated, but the new import experience is finally ready for a test-drive!
You can try importing from one of the 9 most often used brokers, like IBKR, Degiro, Bossa or XTB. All your transactions, dividends and fees will be included.
Please note, that in many cases you will need to export a different file than previously!
Your custom import templates will be automatically migrated whenever possible, and all other brokers and apps will be available soon.
Completely new UI
When you import data for the first time, you will be asked to confirm accounts, assets and currencies that will be used. Each broker has a specific instructions on where to look for the symbols, so it should be much better than the previous version.
Depending on the broker, you may also get some additional information, like what data is currently not imported (but hopefully will be in the future 😉).
Whatever you choose here will be remembered, even if you don't save the preset. Your choices will even be used in other presets!
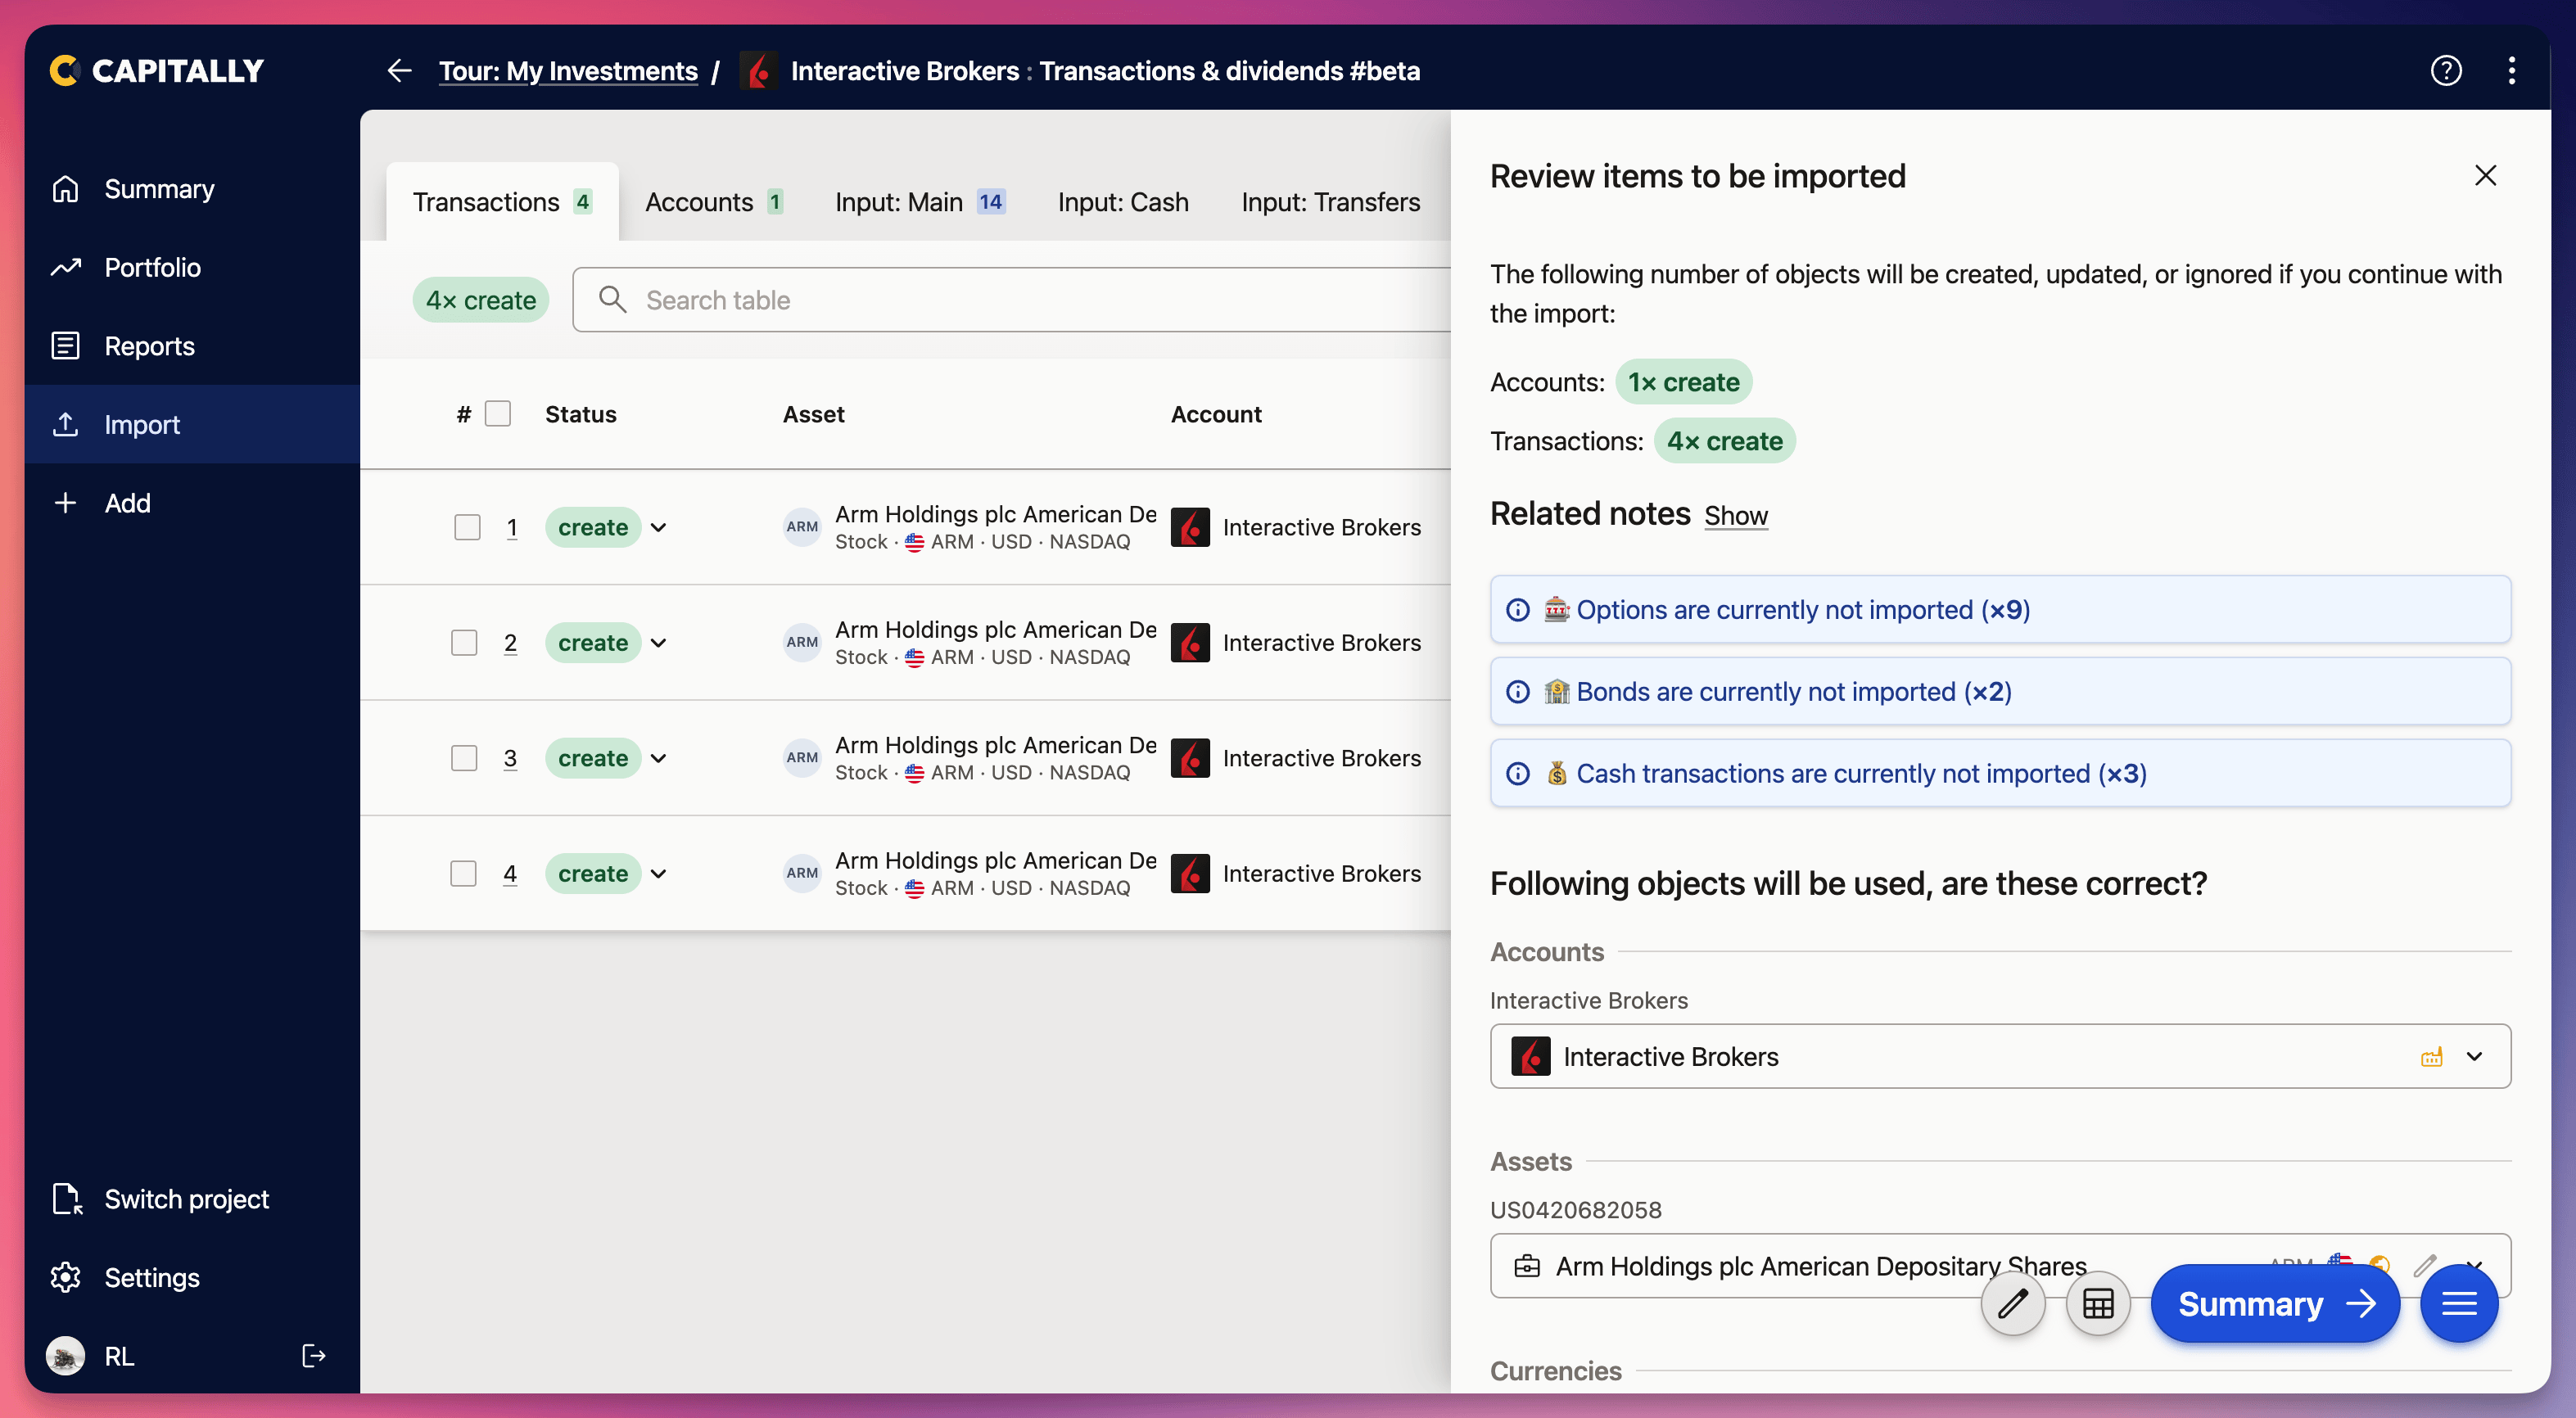 Once you're ready to import, you'll get a summary screen with details on how this import affects your portfolio - so you can confirm your balances or spot a wrong asset.
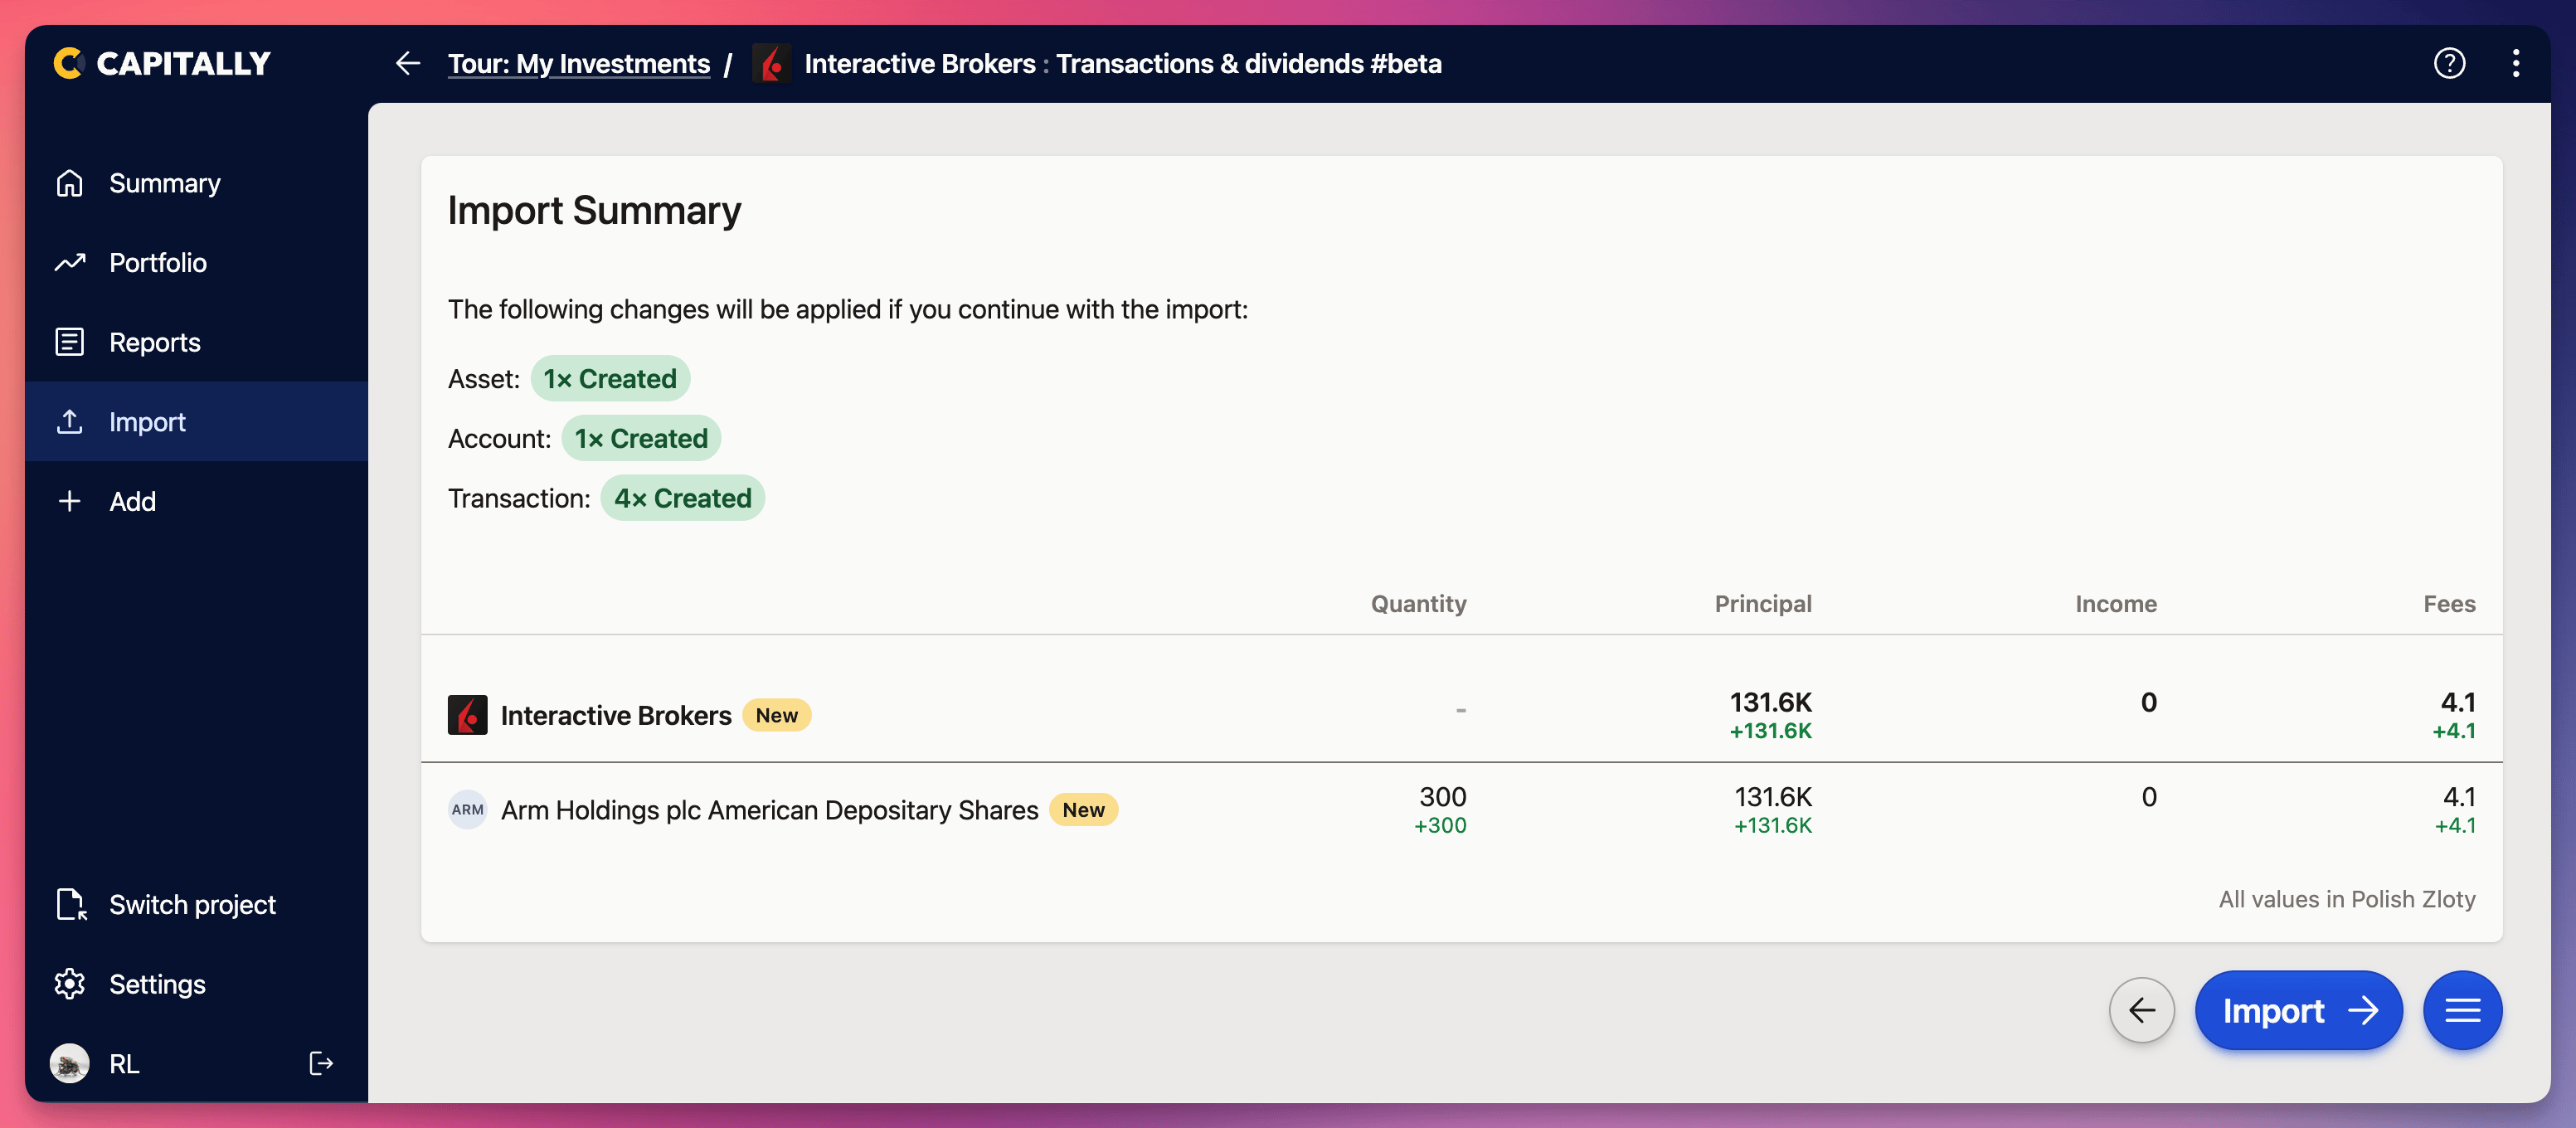 Finally, after clicking
 Import you'll be taken to your portfolio. A toast will be displayed at the bottom where you can quickly revert the import if something is off and make different choices.
Completely new logic
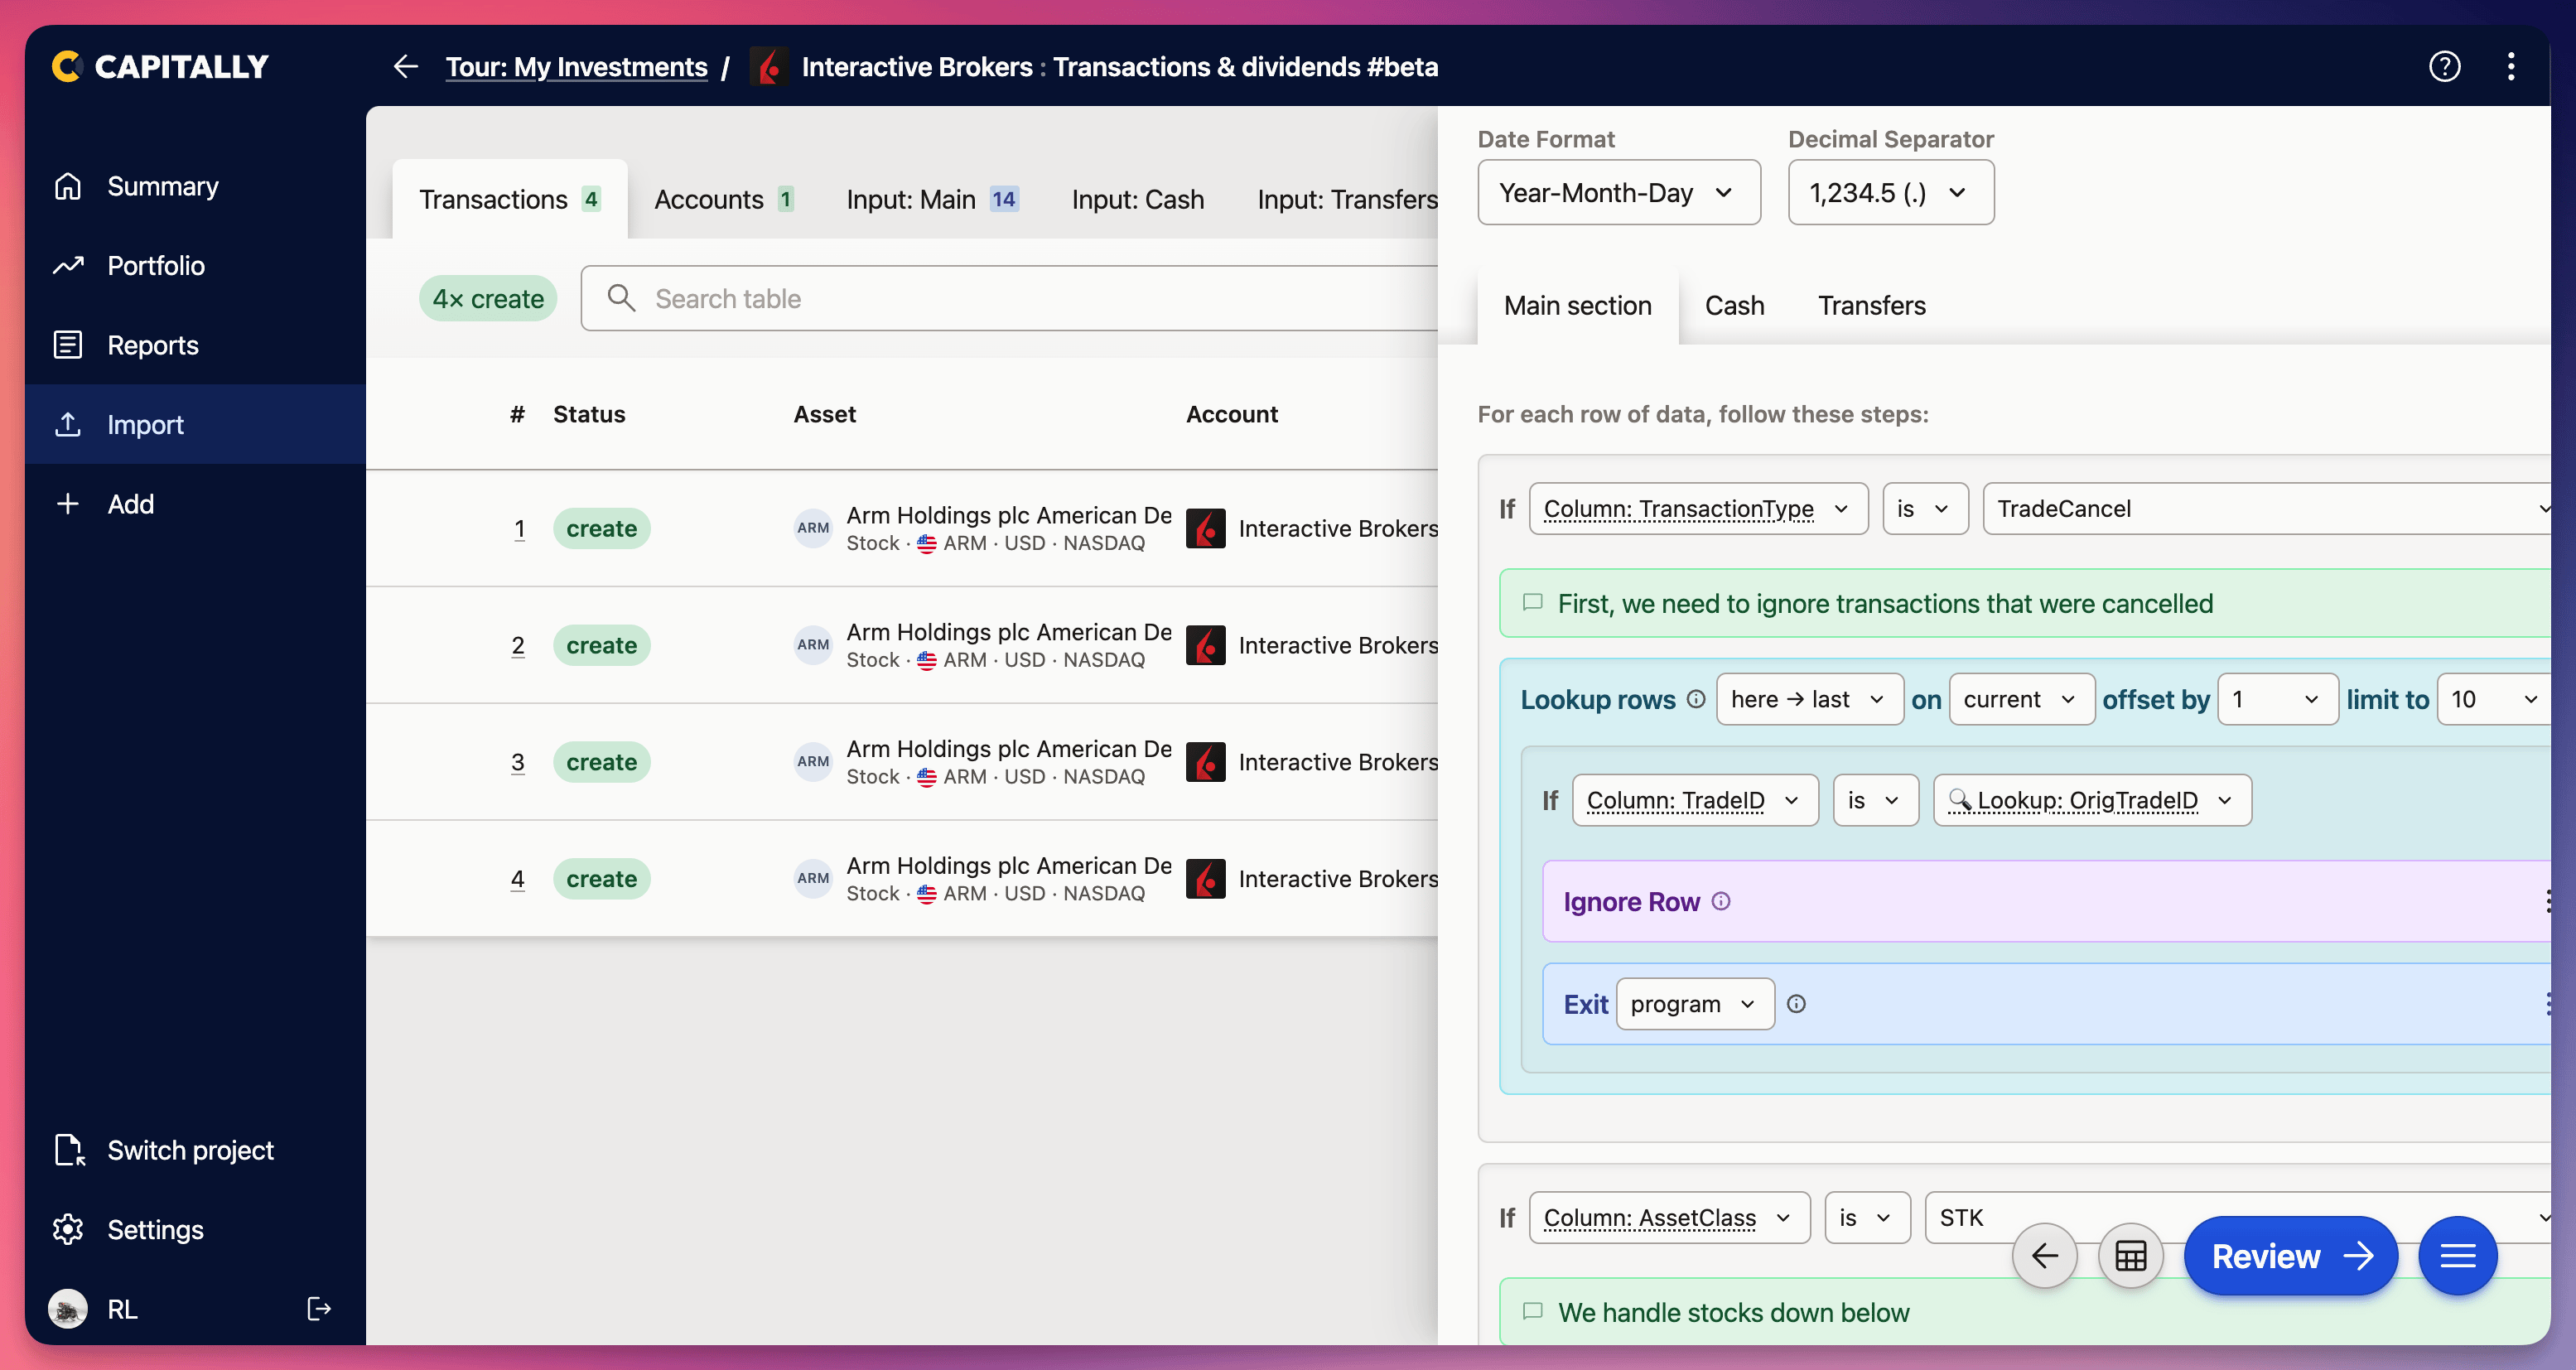
CSV files exported from brokers have some crazy-complex logic, for which a simple column -> property mapping everybody uses is not enough.
Our new system is a no-code tool, the same one we use for taxes, but now heavily extended. Instead of mapping the columns, you can specify what steps are needed when handling a row of data. Edit one of the built-in presets to see it in it's full glory.
As it may be a bit overwhelming, a much simplified creator and a thorough walkthrough will be available soon.
With this huge update out of the door, we should now be back with smaller, incremental updates that are shipped more often.
An easy to use and ultra-flexible importing mechanism is the core tenet of Capitally - you should be able to import from any source without having to "massage" the data beforehand. While we had probably the most powerful setup among tracking apps, it still didn't fully fulfill that promise.
From today, if you enabled the Early Access, you will be able to check out the very early version of new imports experience. For now, it will try to convert your existing import templates to the new format and use them. Soon, there will be new built-in presets with support for Dividends, and you'll be able to edit and create your own.
It's a pretty big undertaking, as the new experience is built from scratch. And as always, there are improvements all around. This time, there are new Toasts with direct access to Undo.

In case of an error, a description will be displayed along with a copy button - once clicked, it will copy the error details if you want to send them to us.
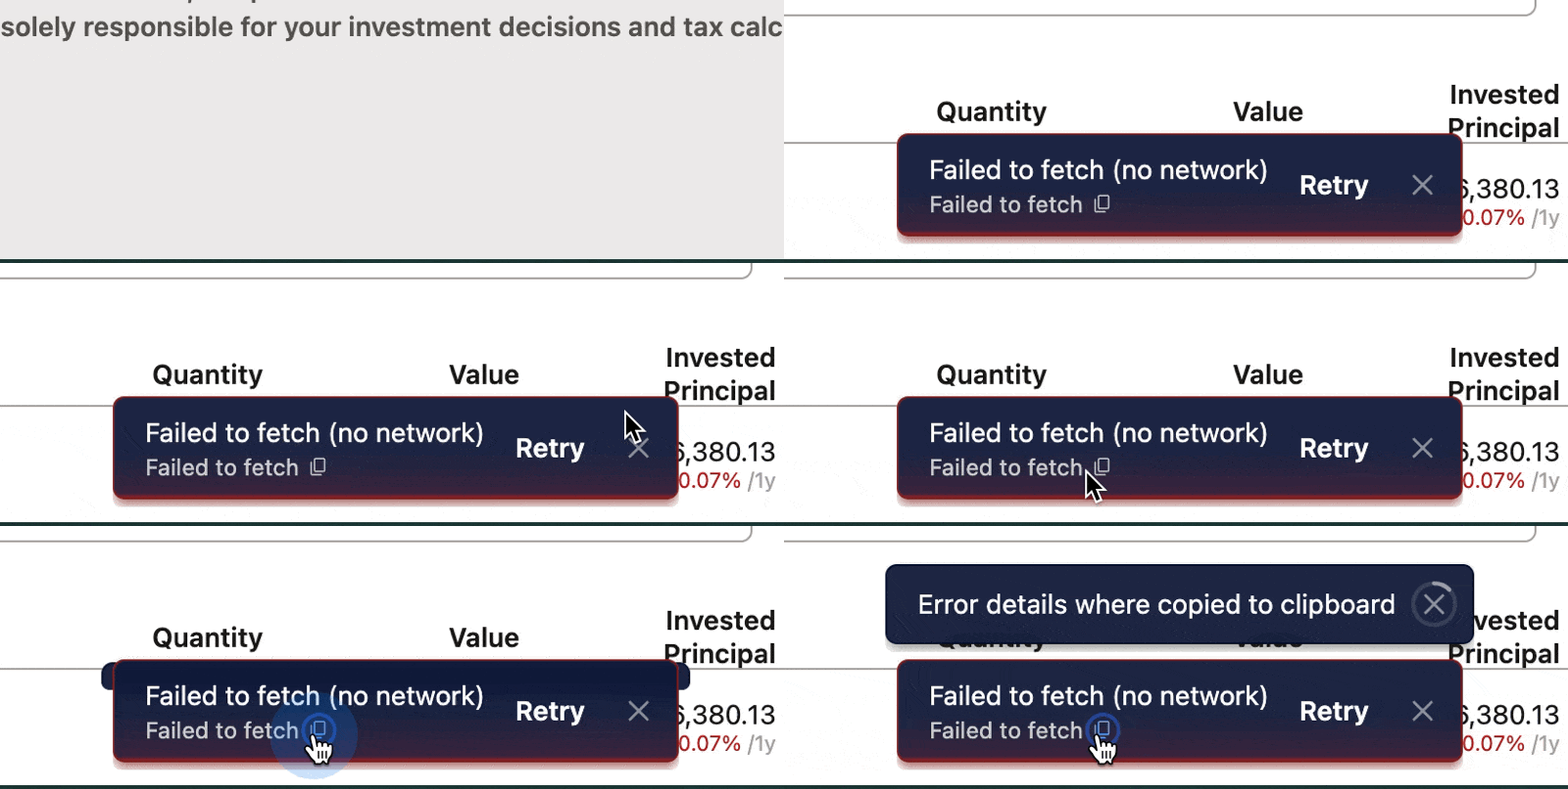
Another one is the top-right loading spinner, which now shows the loading progress - pretty handy on large portfolios.
Recent updates, such as taxes, income estimation, and reinvesting, have added a significant amount of complexity. This made the app slower, especially on larger projects.
However, that's no longer the case. In fact, the latest optimizations have brought over 100x improvement in many typical situations.
The app should now handle over 10,000 transactions across hundreds of assets without issue, leaving ample headroom for upcoming new features.
Today's update is about Dividends and other forms of Income you can track in Capitally. There's a whole article that describes it in details, but let's quickly go through the new stuff here.
Smarter automatic dividends
If you manually added or imported an income transaction, it'll prevent creating an automatic one if the transaction's date is anywhere between the ex-date and two weeks after the payment date. This means less cleanup work for you!
And yes, there's a Payment Date filled for most dividends, so you can immediately see when they'll arrive on your account. There's even a nice Upcoming badge and a Summary widget summarizing those!
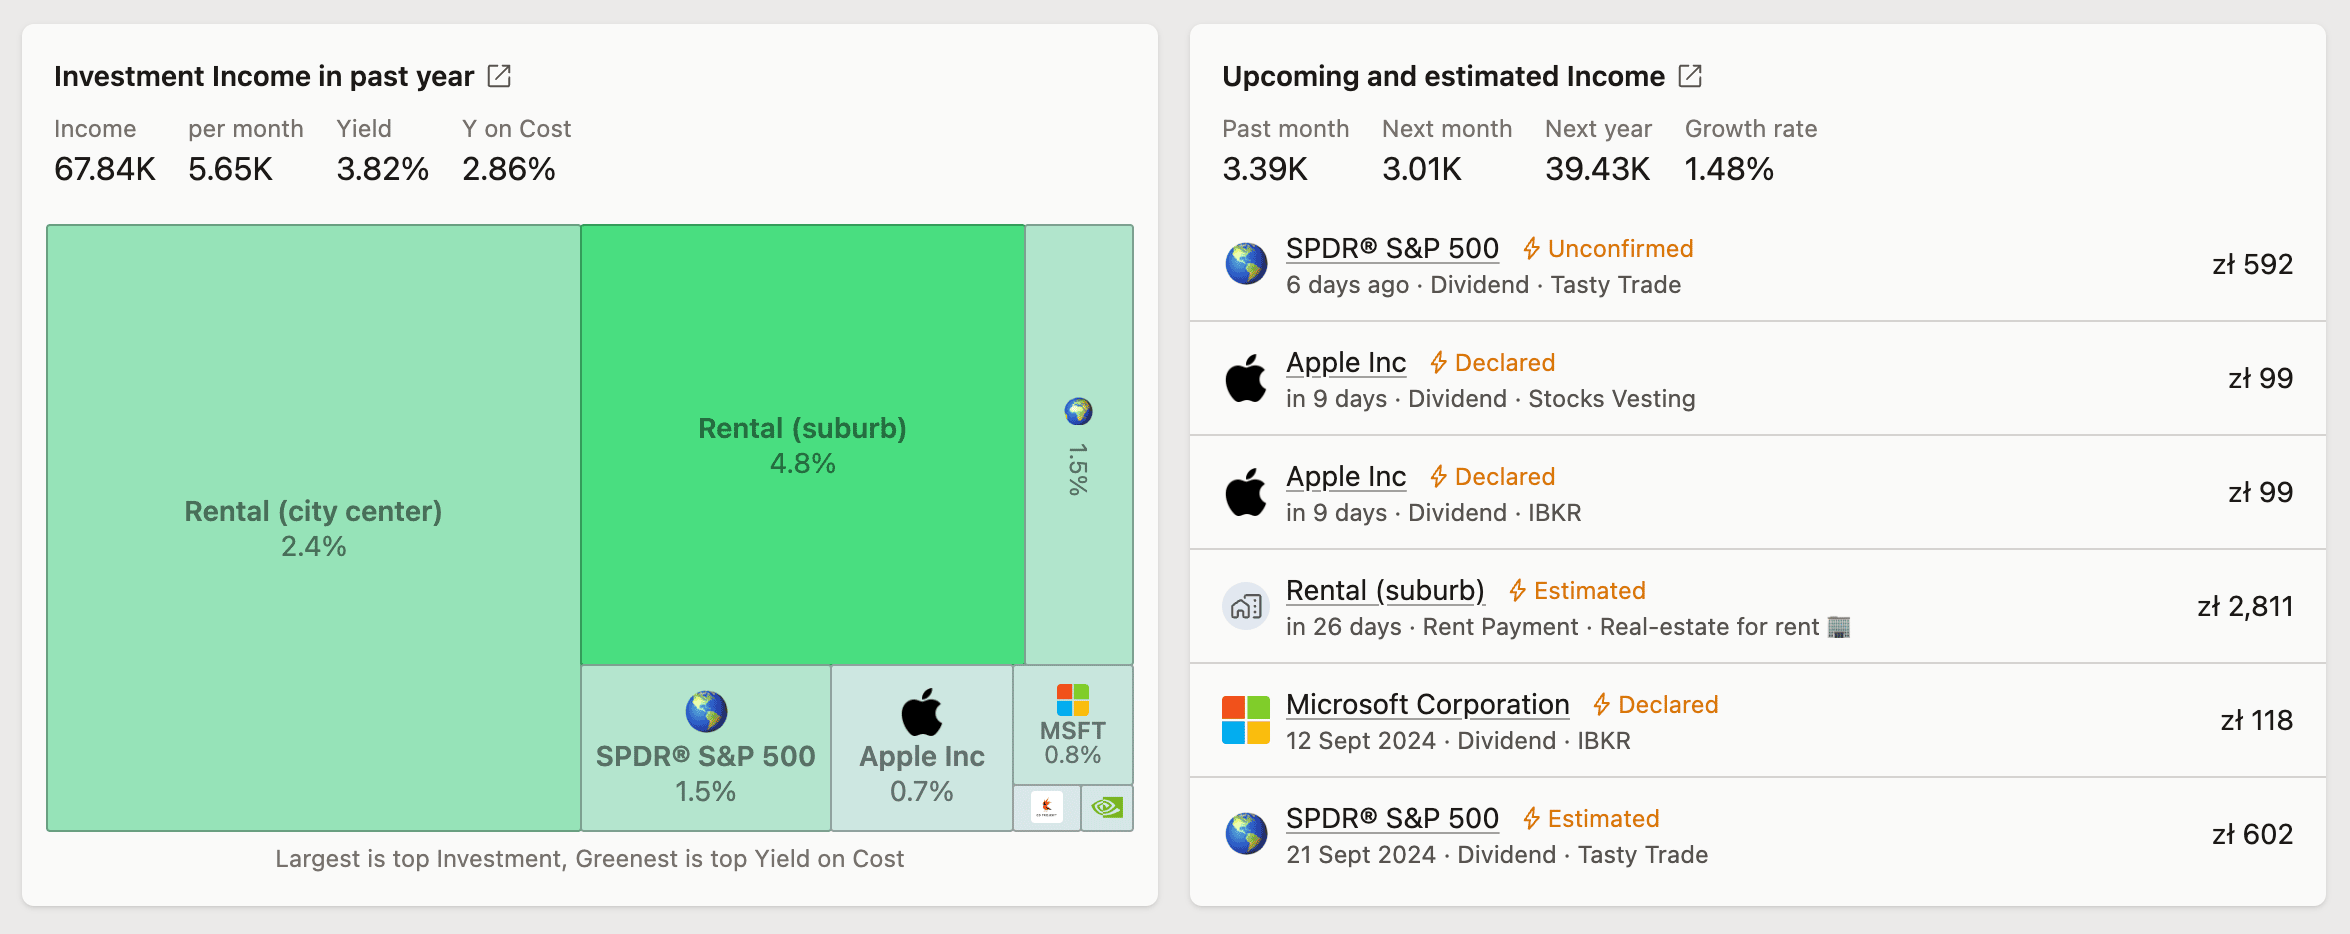
By the way, support for confirming dividend record straight from broker statements is right around the corner as well!
Dividends paid in shares
Ever received dividends in shares instead of cash? Now you can record that in Capitally! Both fractional shares and full shares + residual cash are supported. Check out our in-depth article on how to use them.
Automatic reinvesting & DRIP support
For any asset, account or asset & account combination you can precisely control what to do with automatic dividends. They can be disabled, or reinvested - both with fractional and full shares. You can even set a % discount on share price, which is perfect for DRIP.
Estimated future income
Want to see what's coming up? You can now check all upcoming dividends in both the Transactions list and the metrics & charts. Just select a future date period like +1y or 2024. What's more, we'll estimate the future income years into the future - based on the historical performance.
Our estimation engine is pretty smart - it can detect multiple series of income events per asset (like quarterly dividends plus yearly special dividends) and estimate future events separately. It even estimates Rental income based on at least three rent payments!
There are additional metrics available based on that - Income growth, cadence and streak.
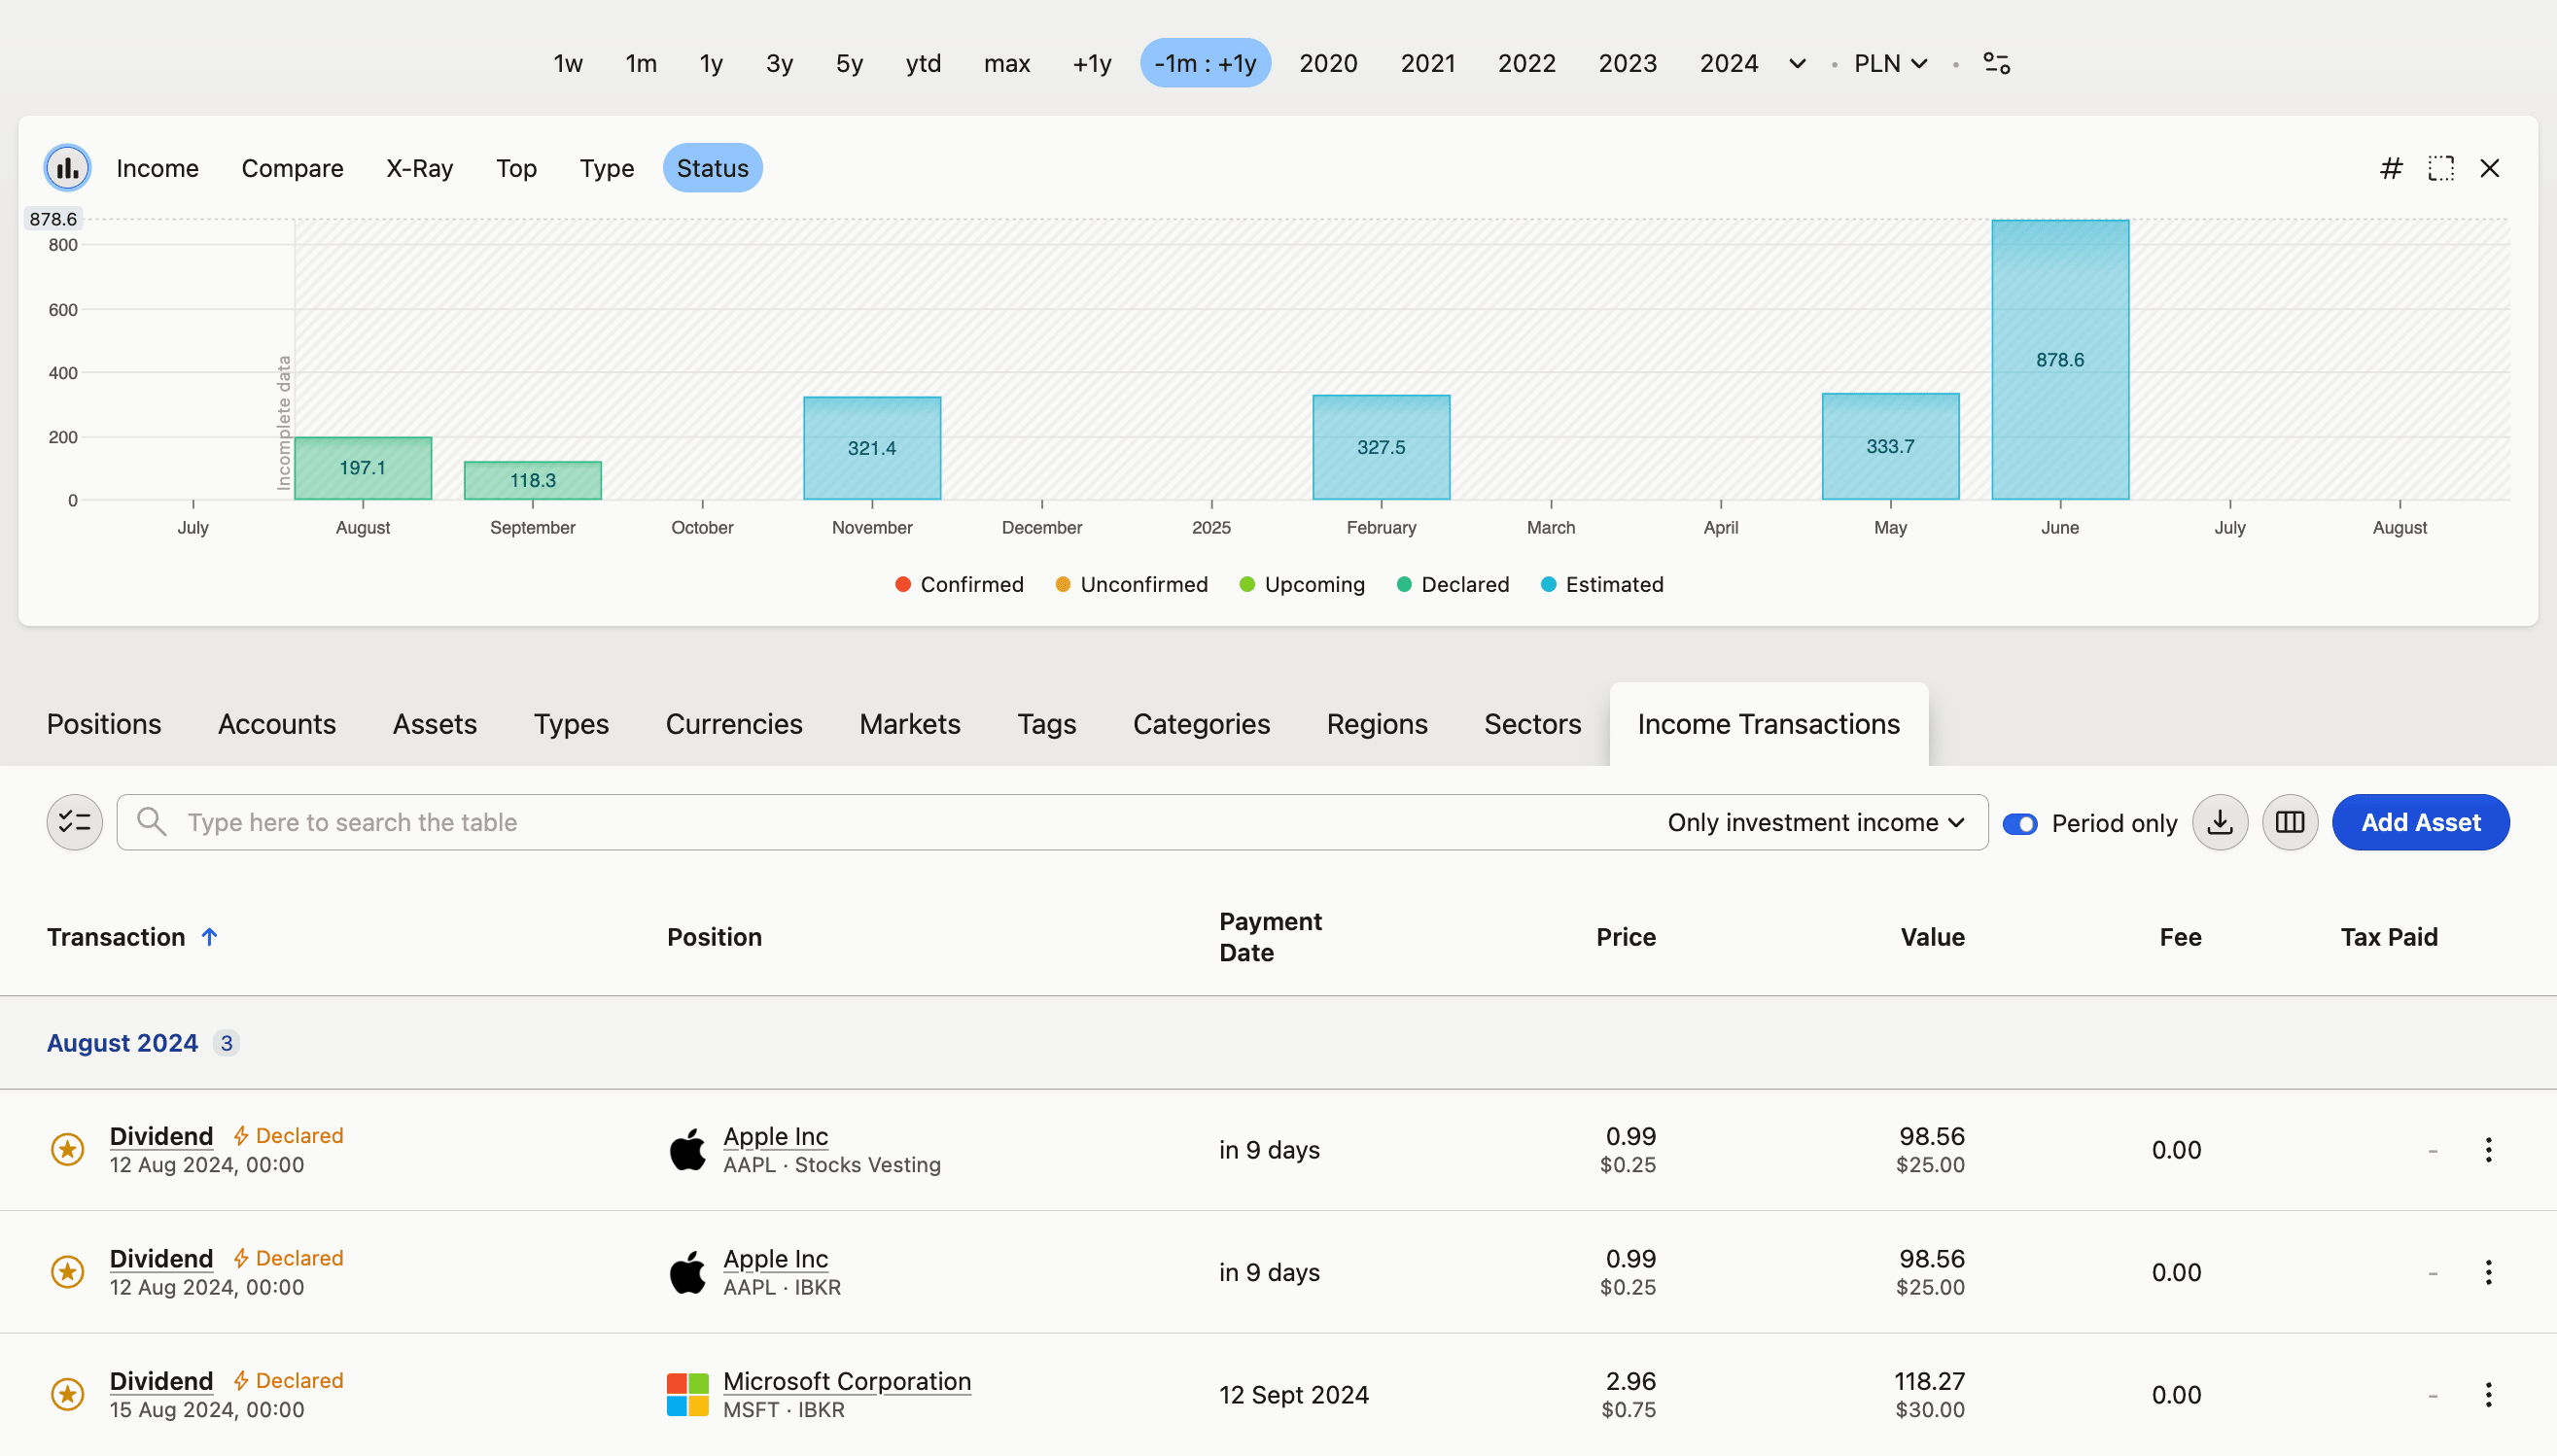
And more!
There are many small improvements throughout as always, but it's worth noting, that:
you can now assign tags to specific Asset & Account combination. Just edit the Asset or Account, and configure it in the Positions tab - just where you can set the Dividends handling
there are two new import templates - PKO and ING Bank Śląski
Work on improved dividends support has kicked off with a complete rewrite of yield calculations.
Yield on market price is now available everywhere, not only in the single asset view. When there are multiple assets, it will show you a principal-weighted average, including assets that don't bring you any income. To keep it in-line with the standard approach, the income always takes into account 1 year of payments. It takes into account both transactions you've added and the marked data, so it now properly covers assets you didn't have for the full year, and any custom assets like Real Estate.
Yield on Cost is now based on the average holding-period principal, which makes it both more accurate and stable across date ranges. If you annualize returns, YoC will be annualized as well, which is perfect for comparison with the Yield on Price.
Also, the Fixed Income has been renamed to Investment Income, or just Income - as it's not necessarily fixed.
If you're interested in improved income support, please enable Early Access as most of the new developments from now on will be available there.
Position Opened / Closed filters now behave differently
These filters now apply only to the actual lots, not to Income events as it was previously. So once you choose lots opened or closed within a certain period, all Income transactions that are related to these lots will always be included. What's really nice, is that they will be included proportionately. So if you bought 100 shares, received a dividend on them and later sold 50 of them, if you filter only opened position, you'll see only the income brought by these 50 shares that remain open.
New filter: With Transaction Type
You can now filter position units by transaction types that relate to them. By selecting only Sell, you will see only units that were closed with a Sell transactions, conversely, you can use is not Sell to see only units that were never sold.
It also works the same with Income transactions. To see only dividend-paying assets, just filter by With Transaction Type is Dividend

Remember that position may be closed by Selling, Transferring or updating it's balance. If you want to see only currently opened positions, then filter by Position Closed is empty.
Plus a few notable changes and fixes:
currency conversion rates will now look for the longest history available, trying to use major intermediary currencies like USD if there's no direct rate that is long enough
on some exchanges, the day's close price was only available a few hours after trading closed - we'll now display the last recorded intraday price in the meantime
on some devices the Add Transaction modal was not opening - it should be fixed now
From time to time our data provider fixes some small discrepancies in the price data or market events. As Capitally has to make a copy of this data to run as quickly as it does, this copy sometimes became out of sync with the source, leading to errors - especially around splits and dividends.
With this update the local copies will be automatically synced again whenever such change occurs, without any intervention on your side.
To make the price update dates more transparent, when you open the Asset's Price tab, you will see the last updated time, a symbol if the price is manual or intraday, and last update time for currency rates.

Have you ever wondered how much you gained or lost by making your move at a certain time? Like, how much would the bitcoins sold 10 years ago be worth today?
This is called Opportunity Cost and the lower it is, the better your timing decision was. Of course, no transactions happen in the vacuum - by selling one asset you could buy another one, and this is already included in your Returns. But the Opportunity Cost may give you this little bit of perspective.
You can add it on the Portfolio's Transactions table, along with Current Market Value.
In addition, there's a built-in support for Revolut Investments and Spanish Savings Income taxes.
They say that a picture is worth a thousands words, and it's especially true if you have thousands of words in a table and you want to quickly find that one asset.
So to make it easier, and also to make your portfolio even more customizable, all objects - assets, accounts, markets, tags, taxonomies - can now have a logo, flag, emoji or just a symbol as their picture.
In addition, you can set a color as well, which will be used on charts and tag/taxonomy labels.
Btw, since Wednesday, taxonomies are nested much more naturally, so you won't see the "/***" anymore. They're now nested like folders.


 Most of your stocks should be updated with logos automatically on the first open. For everything else - just edit the object.
Oh boy, this is a big one. The portfolio charts have been completely overhauled, complete with a new look, new chart types, "privacy" mode and a huge level of customization.
New look
Charts use a new color palette, that is way more discernible, but still easy on the eyes. All visual aspects like spacing, hover effects, transparency and tooltips where highly optimized to find the balance between looks and functionality.
You can also choose one of the three sizes, or hide the chart altogether. On the left axis, you will always see the min & max labels, and you can always toggle the transaction markers, which are now drawn directly on the line series. Plus if you hover the marker, you will see the icons for transaction types that occurred within the hovered period.
And finally, there's a legend under the chart, where you can quickly highlight the series and toggle them. With a double-click, you will hide all series except the one you clicked. 🦉
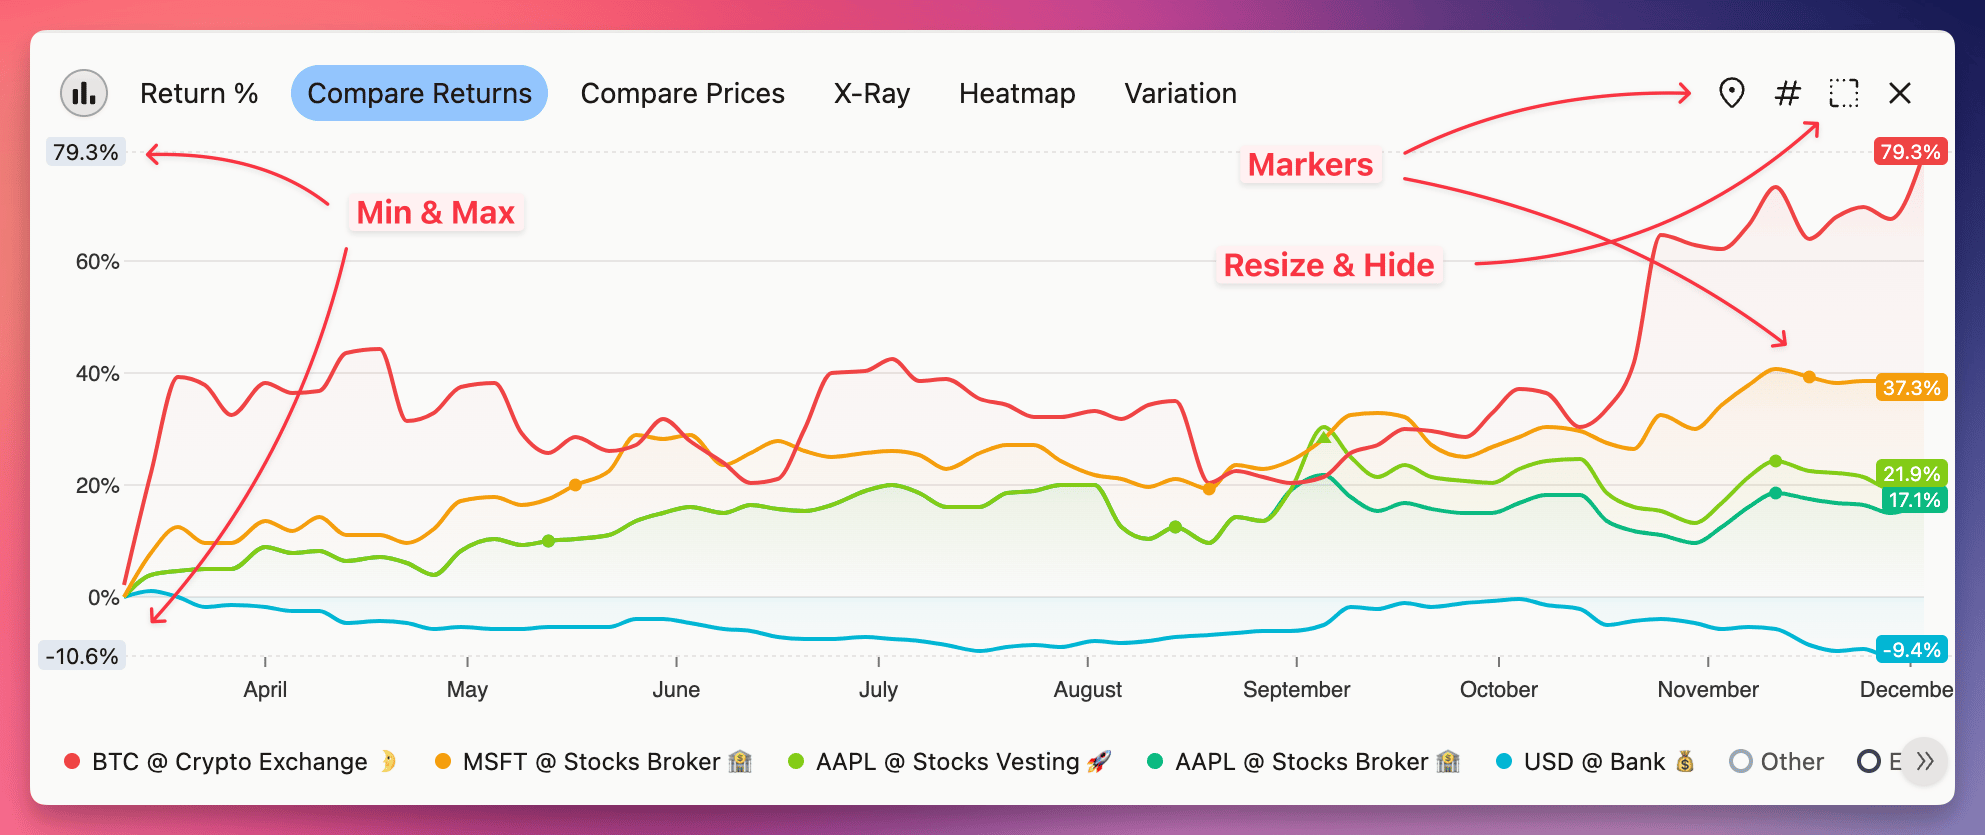
New chart types
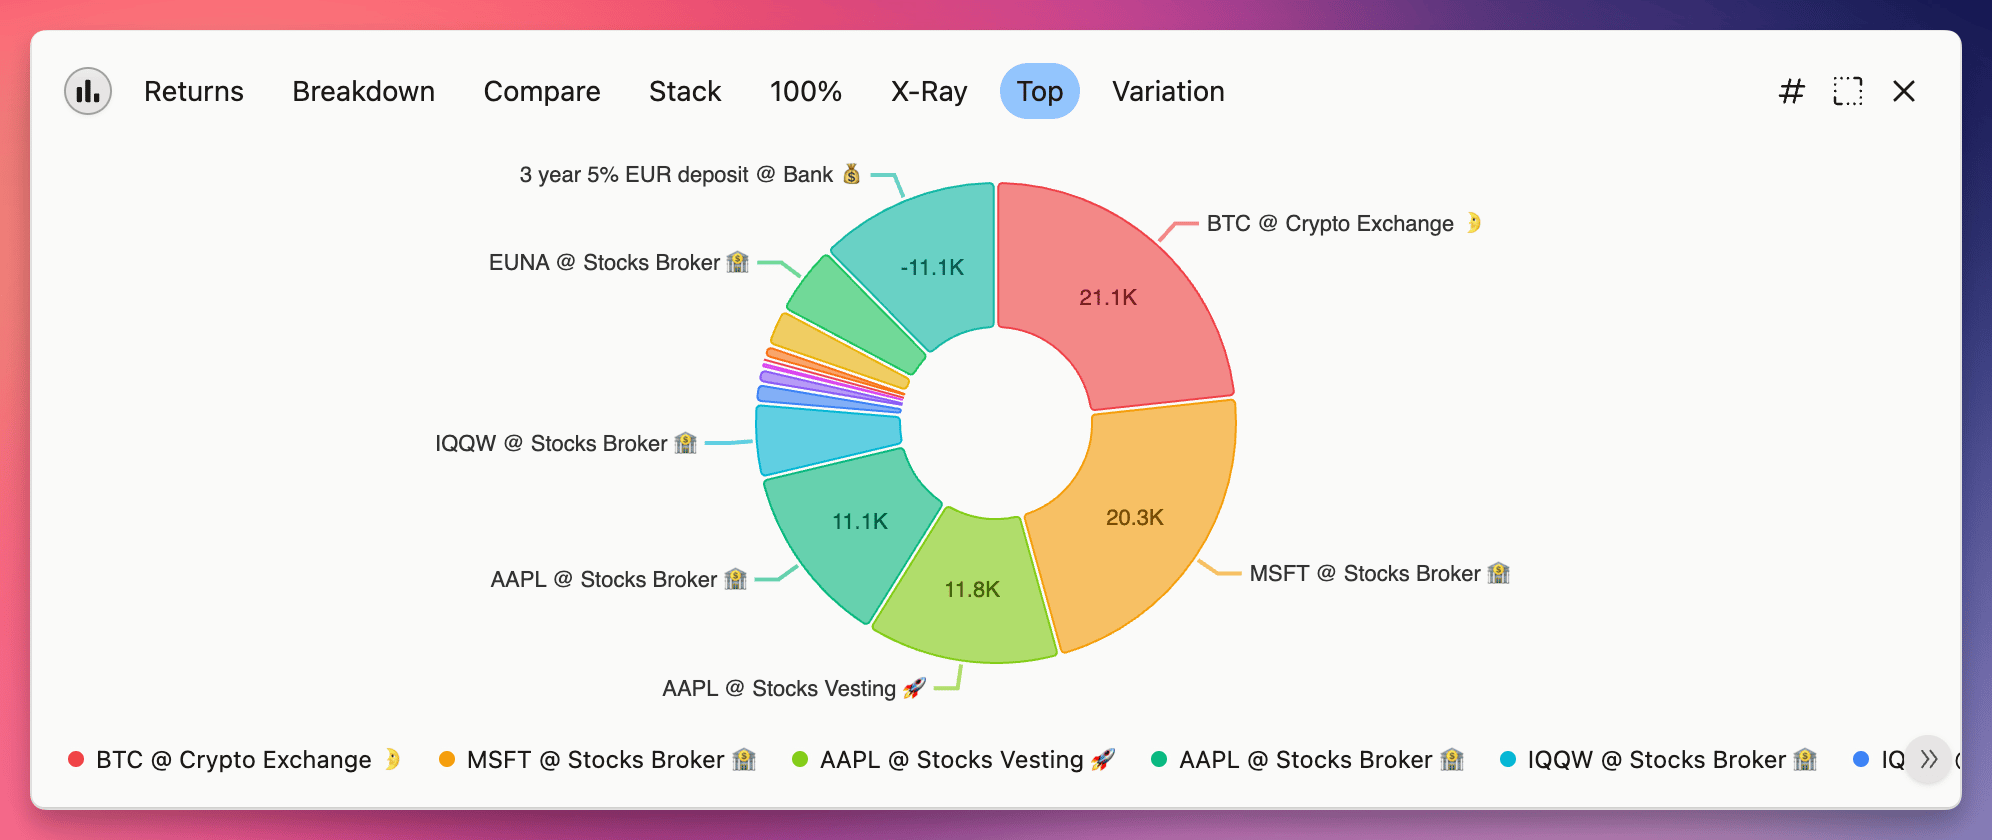
I think the venerable Donut doesn't need any introduction...
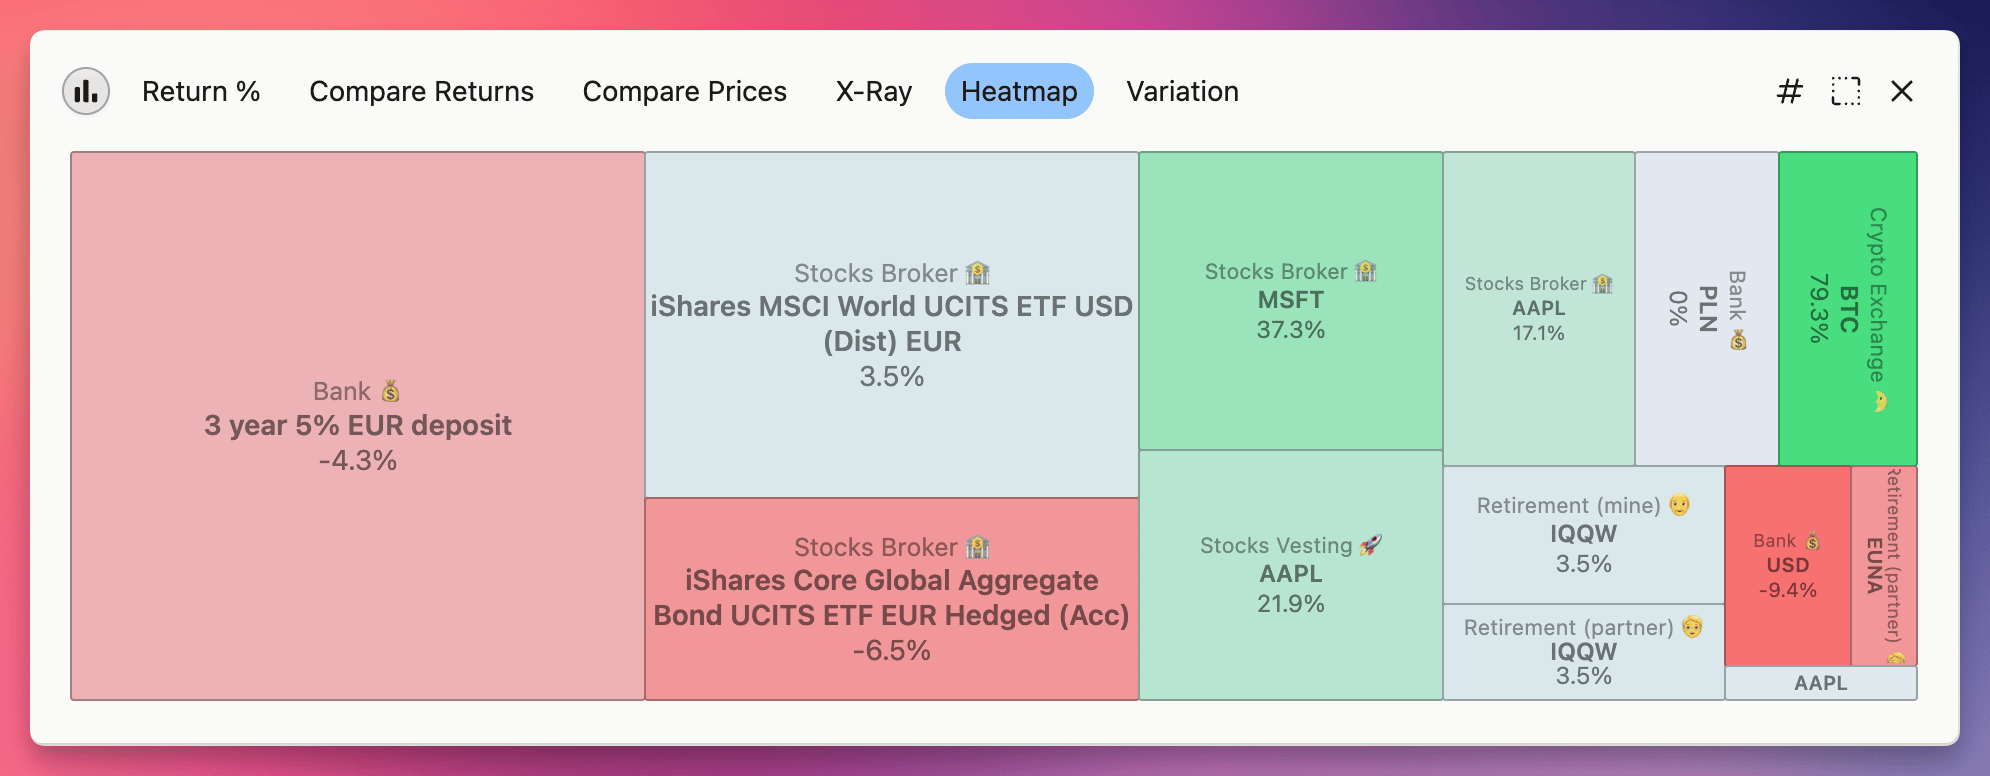
 Heatmap uses colors to tell you how different parts of your portfolio performed. The size of the rectangles is based on a new metric - Average Invested Principal - so even if position is closed, you can still see it here.
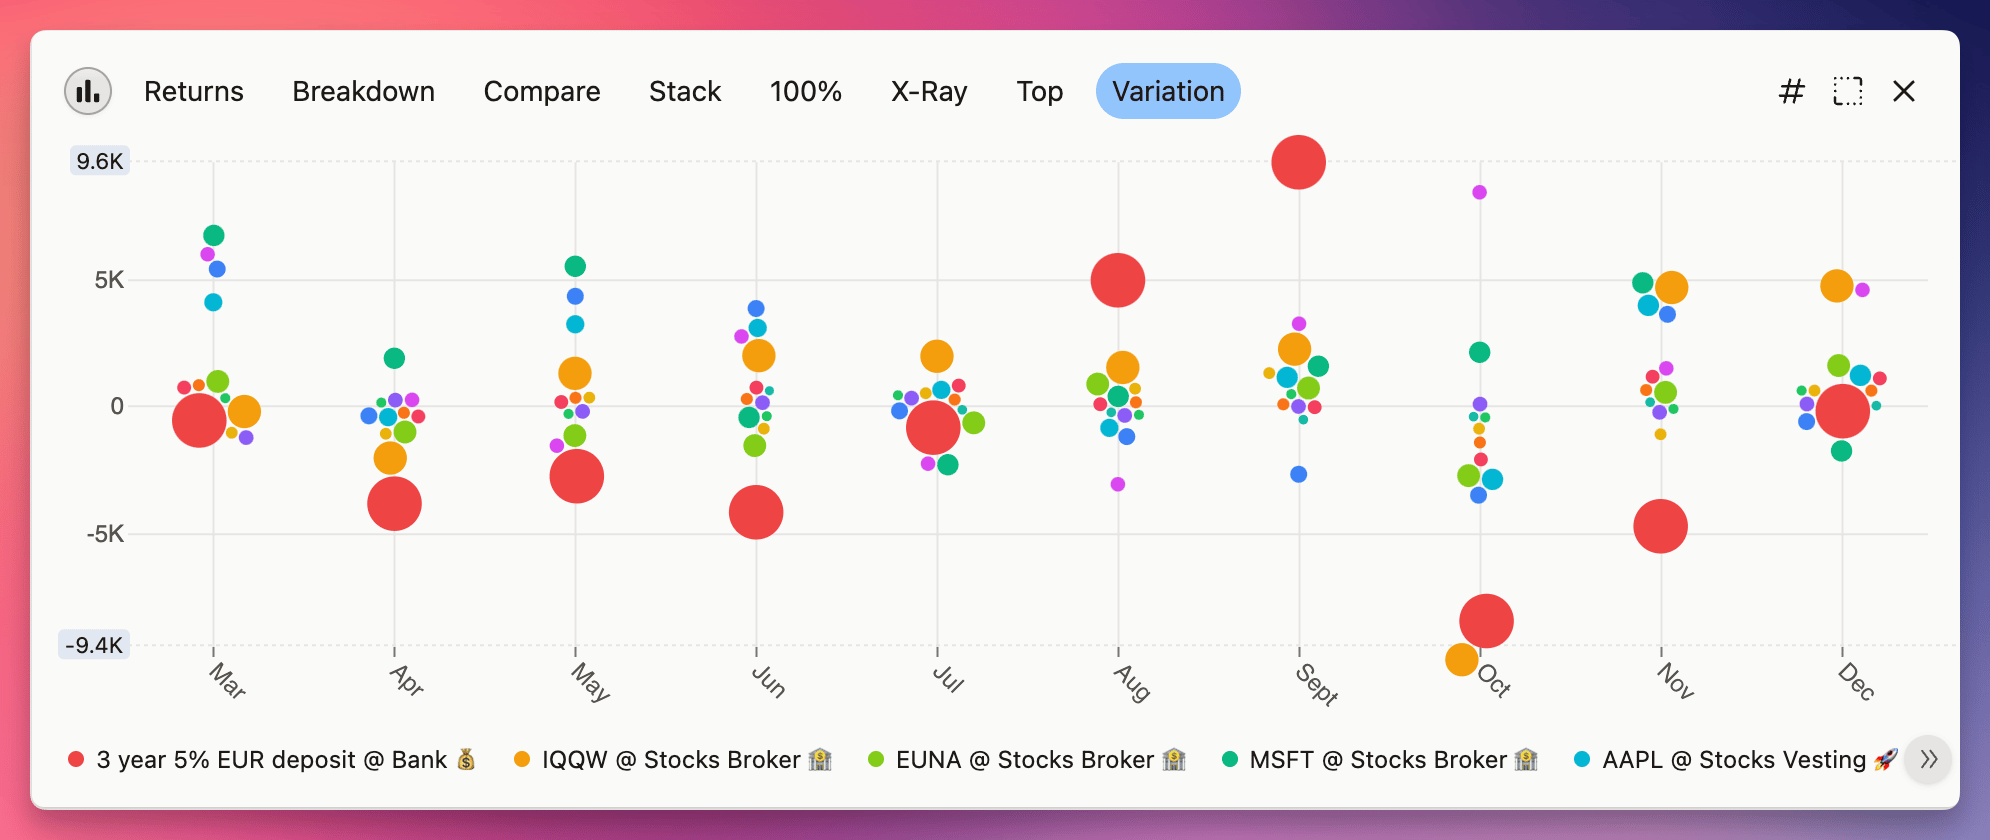
 Variation (or Swarm) shows how much of variability is in your portfolio and where it comes from. The bigger the circle, the bigger the Average Invested Principal - so big circles that are far from 0 will have a large impact on your returns.
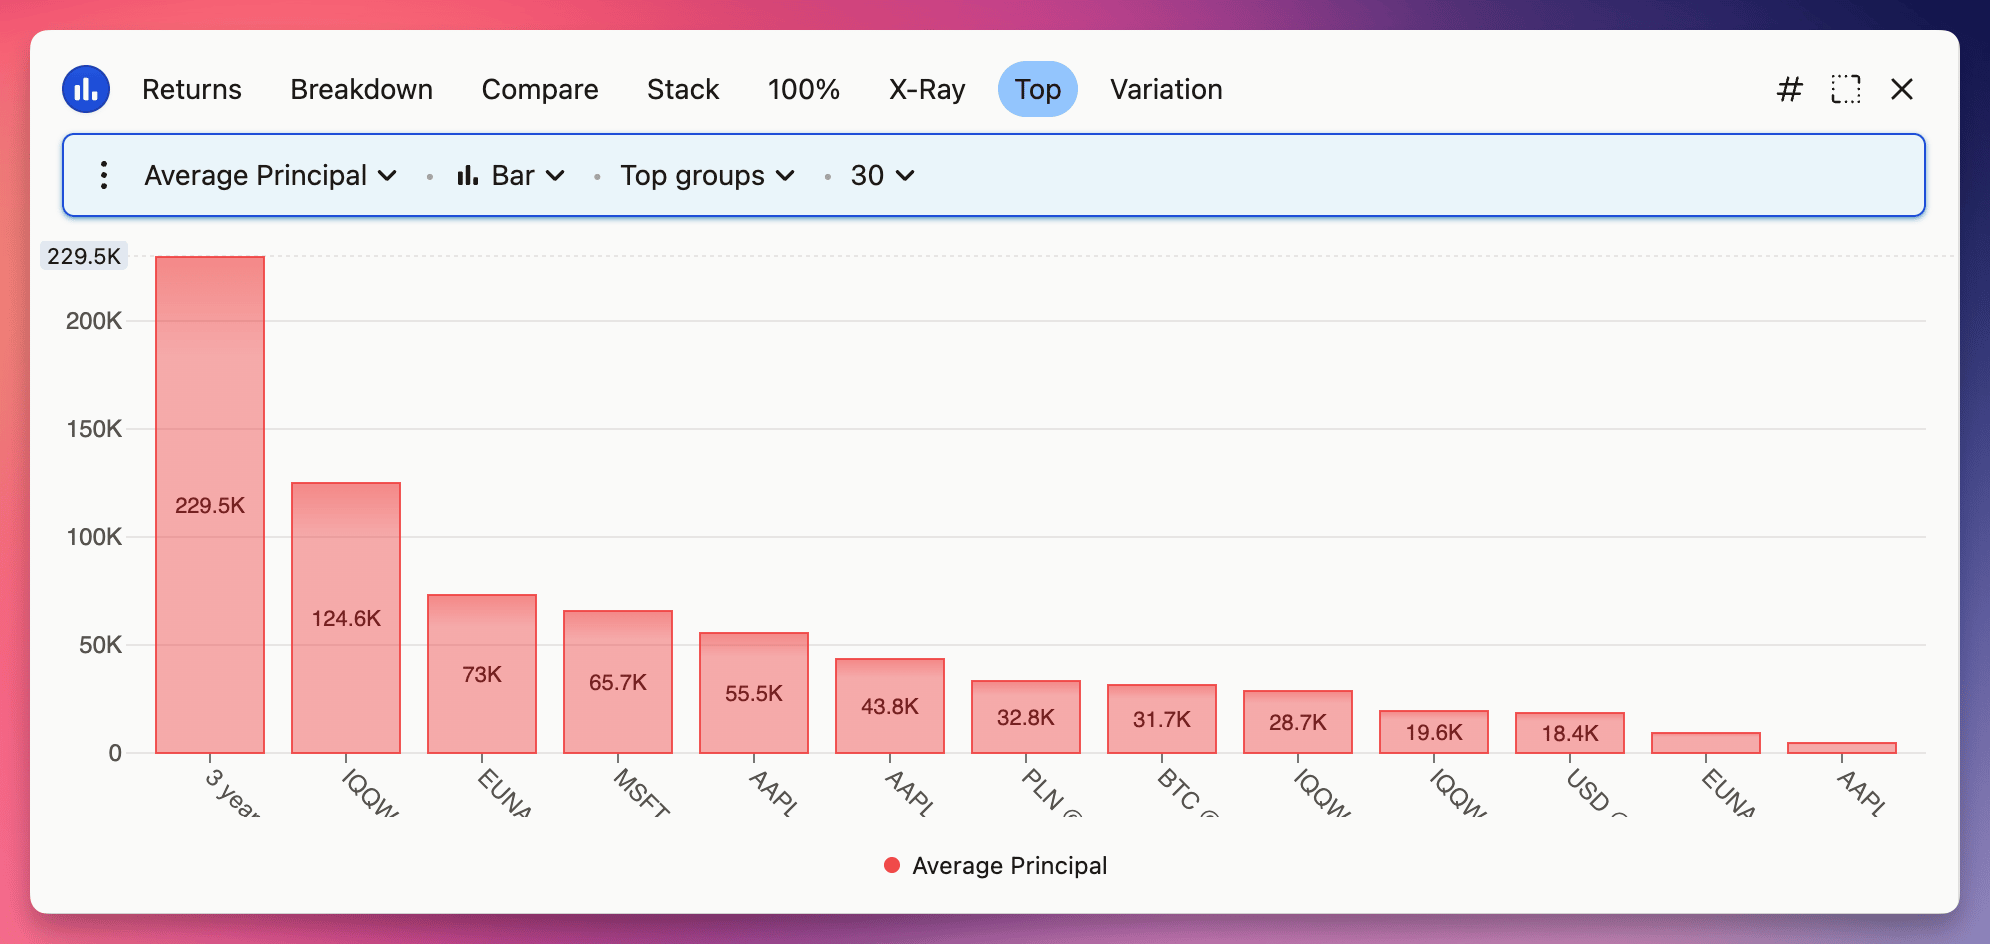
 And you can edit any of the charts by clicking on the chart button. There's plenty of options to discover, plus one "hidden" type of chart - a typical Bar chart, but displaying groups instead of dates as bars.
"Privacy" mode for perfect screenshots
Ever wanted to share with somebody your portfolio composition without giving them too much details? Well, now you can toggle any chart from numbers # to percents %. Just remember, that tooltips still display all the details. Also, it can be quite helpful to quickly compare values with each other, and works on all types of charts.
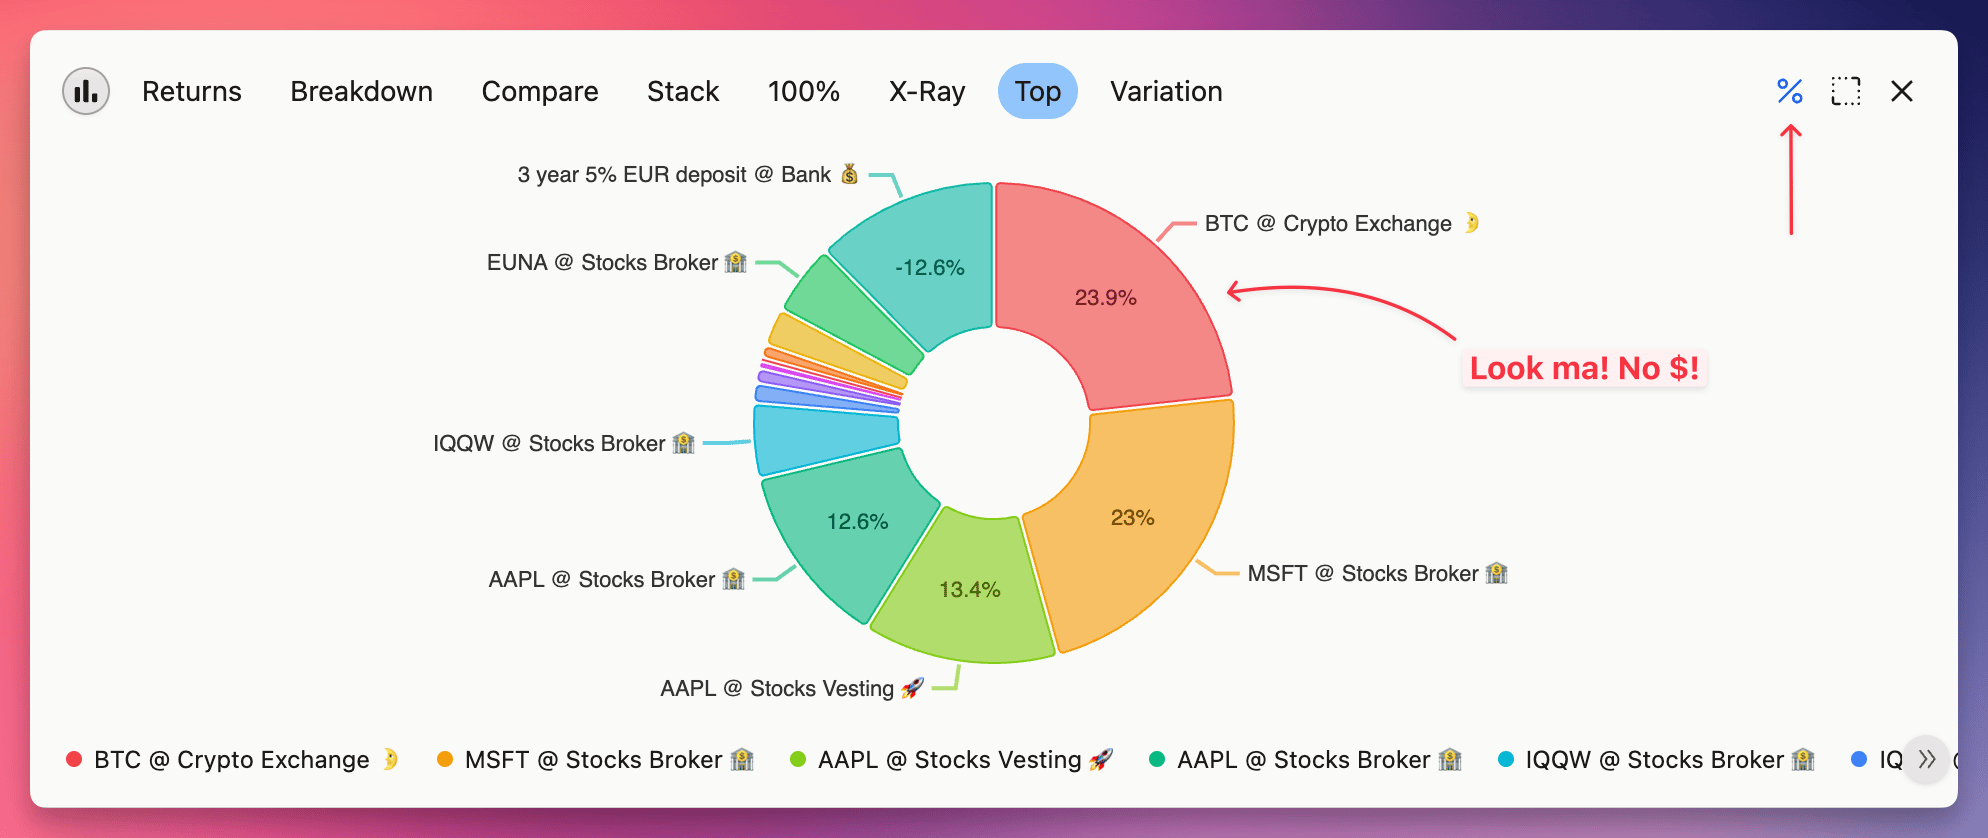
Make your own chart (or change existing one)
And finally, similarly to how Filters work, you can save any changes to the built-in charts, create new ones or delete them. All changes will be synchronized between devices and you can undo them whenever you make a mistake.
Too much? Here's a 12-min walkthrough
You can now precisely select which early access features you want to use.
There's a new tab under settings - Early Access, where you can control them.
There's a notable new one - Chart Presets - and these will be frequently updated in the days to come. Check them out and remember leave your feedback on the roadmap.
There's also one notable change to charts for everyone: Compare, Stacked & 100% charts will now always display 5 top sorted by the metric (instead of top 5 from the table).
This update gives you even more control over how portfolio returns are calculated and refines some aspects to make it more accurate.
There are two new articles that describe how these work: Calculating returns in help and Measuring Investment Performance on our blog.
Improved Time Weighted Return
TWR should remove all investor actions from returns. Previously buying or selling at a discount was included in TWR. Now it's entirely removed and only the closing prices are used for calculation.
By using TWR and excluding Taxes, Fees and Other you now how a great Rate to compare your asset allocation strategy with benchmarks.
Improved cashflows in Return on Investment
ROI simply compares cashflows coming in & out of position. Previously however, if you reinvested money from a closed position, it would be counted twice, making the return much lower than it should be. The cashflows are now tracked to mitigate this.
Annualized returns
You can now choose to annualize any Rate of Return. We recommend using the Auto option as it will annualize only periods above 1 year.
All the rates will be annualized, including Price rates and Benchmarks.
Excluding Fixed Income and Other transactions
You can now exclude Fixed Income and value changes reported in Other transactions. This will be reflected in Return, Realized Return, Capital Return and Rate of Return.
If Fixed Income is excluded, it will be removed from benchmarks that are based on assets as well.
General improvements
IRR is now more accurately called MWR
The options selector and description popups have been completely overhauled, hopefully educating you on what the choices mean and what is enabled.
The Returns tab will now be labeled with appropriate metric name, so you can understand at a glance what returns are enabled. You will see Total Returns, Nominal Returns, Total A-tax Returns and so on.
As always, you can change the calculation options in the Settings -> Analysis or on the Portfolio page
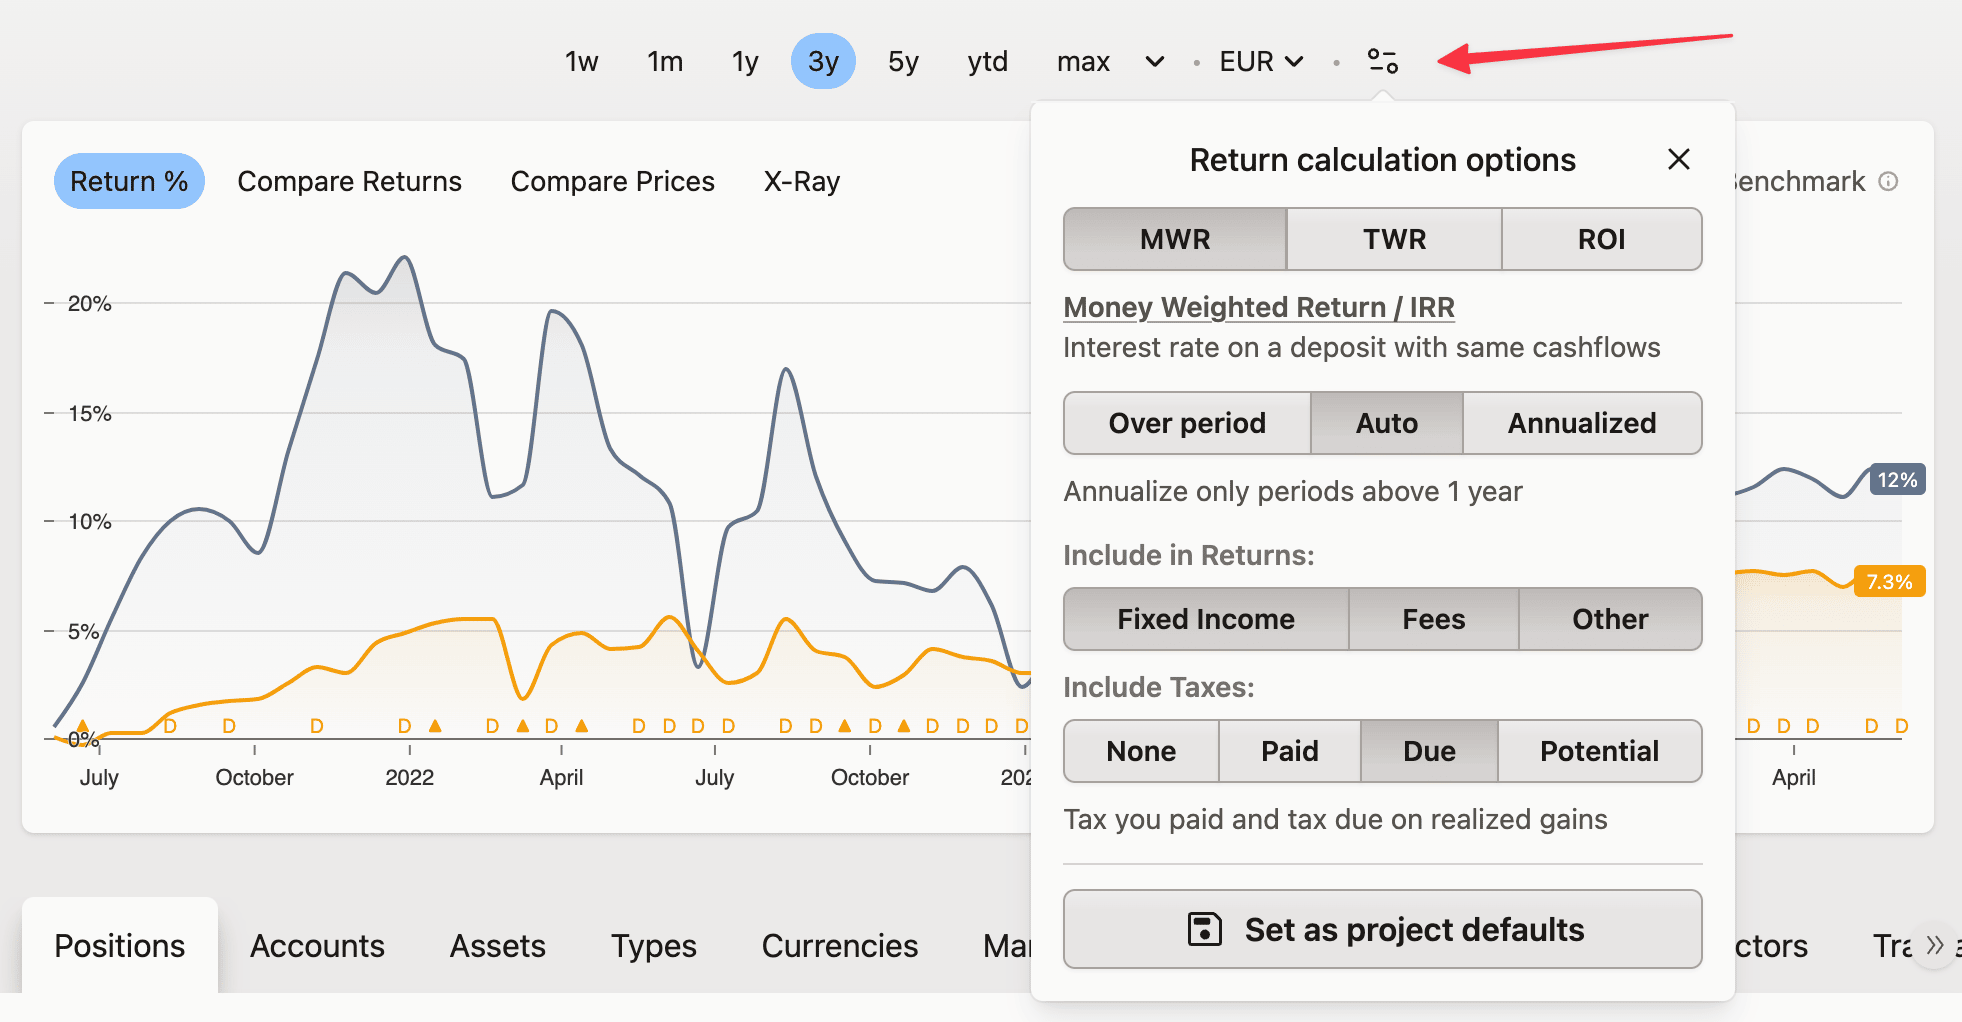
The following settings will now be synced between devices, which also means you shall never loose them and can undo changes:
Date periods
Portfolio table options, like enabled columns or view density
On a related note, two small proposals from our users were implemented as well:
Keep them coming! ❤
I'm excited to announce the launch of our brand-new Community Forum, and I'd love all of you to become a part of it! 🥳
This is your chance to connect with other awesome people who share the interest in growing their wealth and help shape the future of Capitally.
In the forum, you also can:
Plus, if you're a subscriber, you'll get exclusive access to the Subscribers Lounge and a real-time chat where you can hang out with other members! 😎
Joining the discussion is super easy – just use your existing account to log in, and your profile will be set up automatically. From there, you can customize your username, name, and avatar to make it your own.
I can't wait to see you in the forum and hear your ideas! Let's build something amazing together. 🙌
To find the forum, just look for the link in the top-right menu of the app.
See you there! 😁
This update fixes a few issues we've discovered lately:
Some crypto and fractional shares transactions could cause issues with calculating returns and FIFO order. We've increased the internal floating precision we can handle to 9 decimal digits (previously we handled 6) and fixed some issues with transactions that require higher precision.
The Coinbase import was updated to the newest format. There's now additional
Coinbase (conversions)importer that will handle any token conversions you might have.Exporting an account that uses a custom tax preset will export the preset as well.
When adding Buy/Sell/Transfer transactions in a different currency then asset's, you will now see the market price in the currency of your choice. They will also display for transactions on Cash accounts.
Additional columns are now available in Taxes Due Report to give you more context about where the numbers are coming from:
Opening Transaction
Opening FX - Foreign exchange rate applied to opening transaction
FX Rate - Foreign exchange rate applied to the closing transaction/dividend value/market value
Remember, that Income & Revenue depend on the tax preset and might be different from the values in the transactions.
If any of the included transactions where unconfirmed (e.g., auto-generated dividends), a warning will be displayed asking you to review them. There's a link that will open the Portfolio with options applied to make it easy for you to review and confirm these transactions.
Lastly, there's a link that will open the Taxable Income Report with the same currency & filtering settings as you're currently viewing in Taxes Due.
Spring cleaning is here, and we've made it super-easy for you to tidy up your data. You can now select multiple rows and modify many items at once. Change the account, tags, or taxonomies, or simply delete the items you no longer need.
Copying or exporting selected rows is now possible as well. We've added a new option to export items in the Capitally format, which you can later import into another project.
Filtering selected rows is also available. You can choose to include only the selected rows or exclude them from the view. It's a regular filter, so you can save it for later use.
Each row type supports different operations. If you select rows of different types, you'll only be able to use the operations that they have in common.
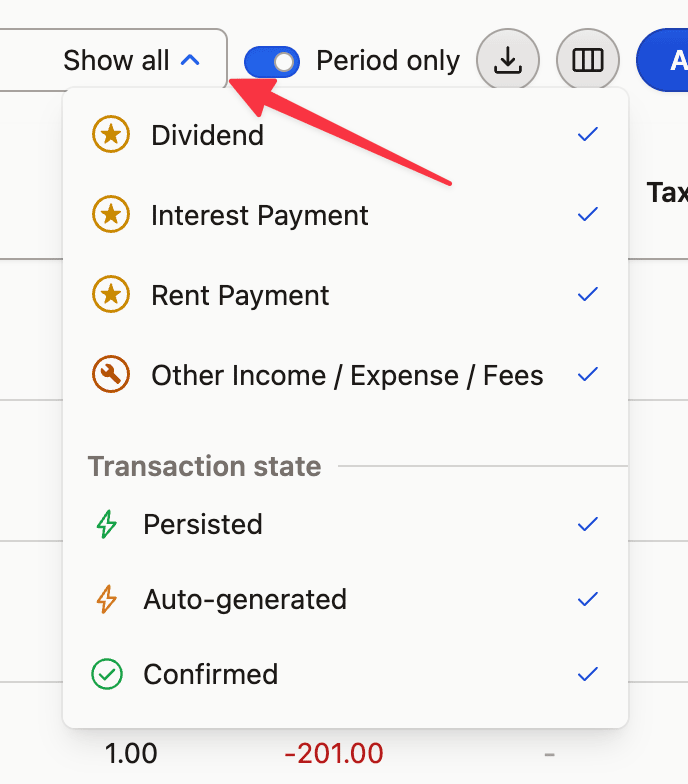
Finally, transactions tab now has a separate dropdown where you can toggle transaction types and states. For example, you can view only unconfirmed dividends, allowing you to verify and confirm them in one go.
You can now organize your accounts into nestable folders.
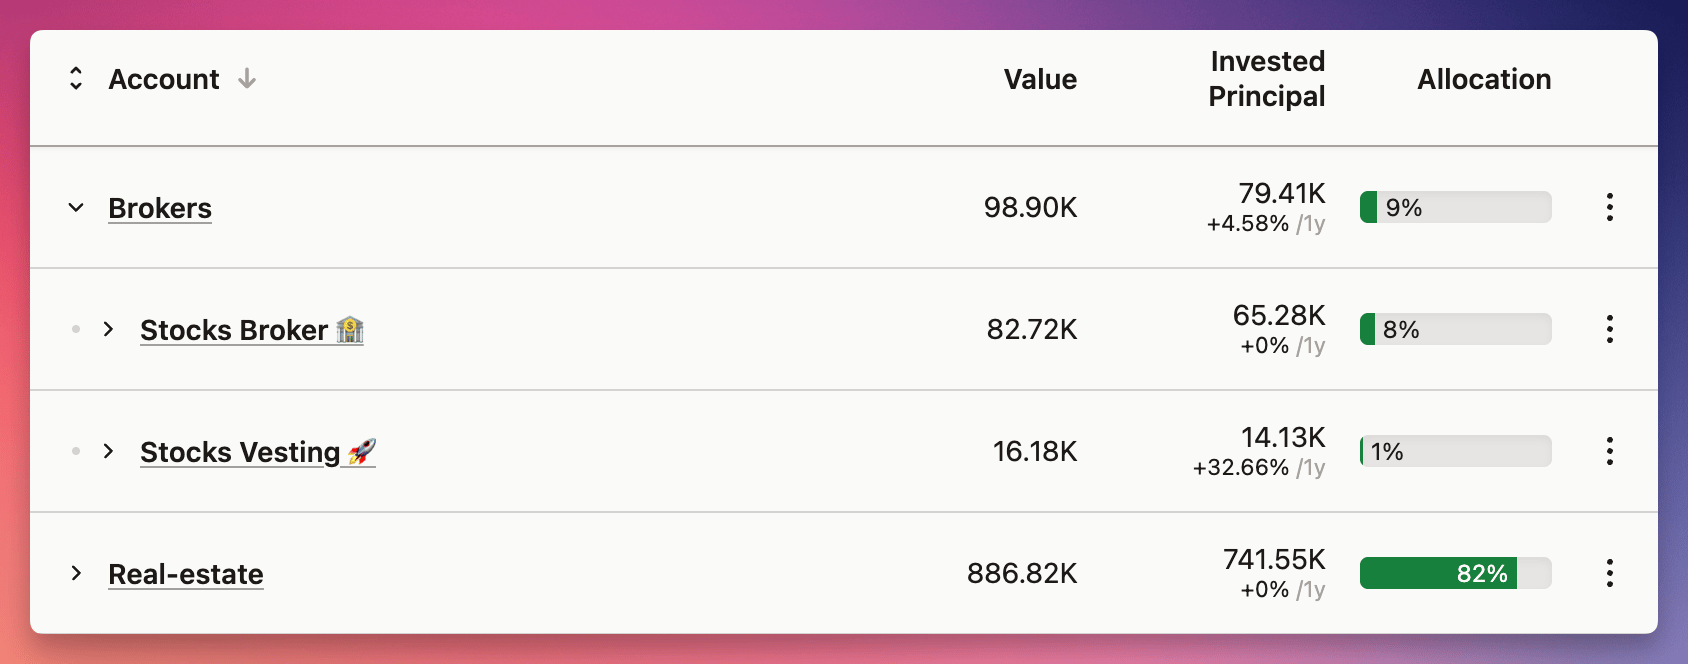
To create a new folder, simply type its name when editing the account. To create a nested structure, use the "/" character (e.g., "Brokers/Foreign").
You can now choose positions using powerful filters. You can quickly create a new filter or reuse ones you've previously created and saved.
These filters are indeed powerful - in addition to choosing specific assets, accounts, markets, or tags, you can also include only positions of a certain age, those opened on specific dates, or only those that are still open.
You can apply these filters in the Portfolio, Reports, Push Notifications, and Summary sections.

Moreover, you can use any of the filters (or accounts) as your benchmark! Simply start typing the name of the filter or account to find it. The return rate calculation method used will be the same as the one you've chosen in the Portfolio/Project settings.
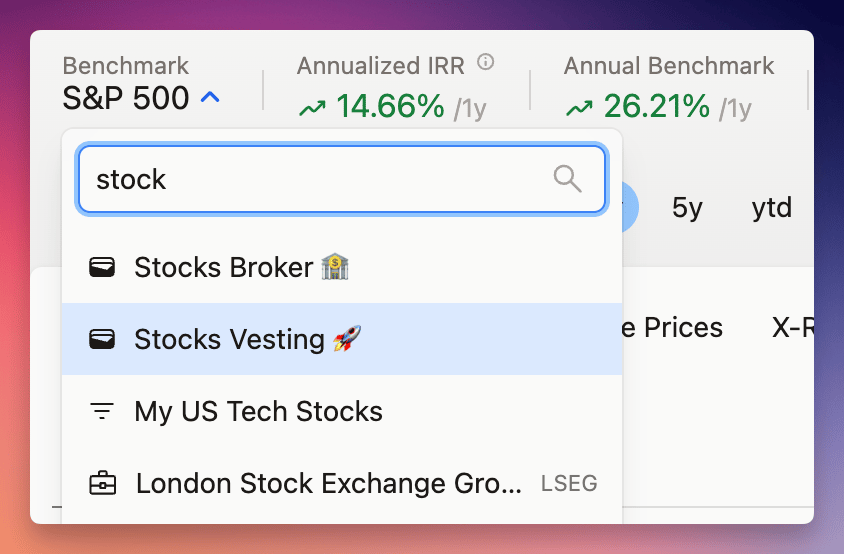
To make it easier to compare longer periods, a new "Annual Benchmark" metric has been added next to "Annualized IRR".
Please note that from now on, searching within the Portfolio table will only affect the table and charts being compared.
Additionally, two new import templates have been introduced for Spanish Self Bank and ING Direct.
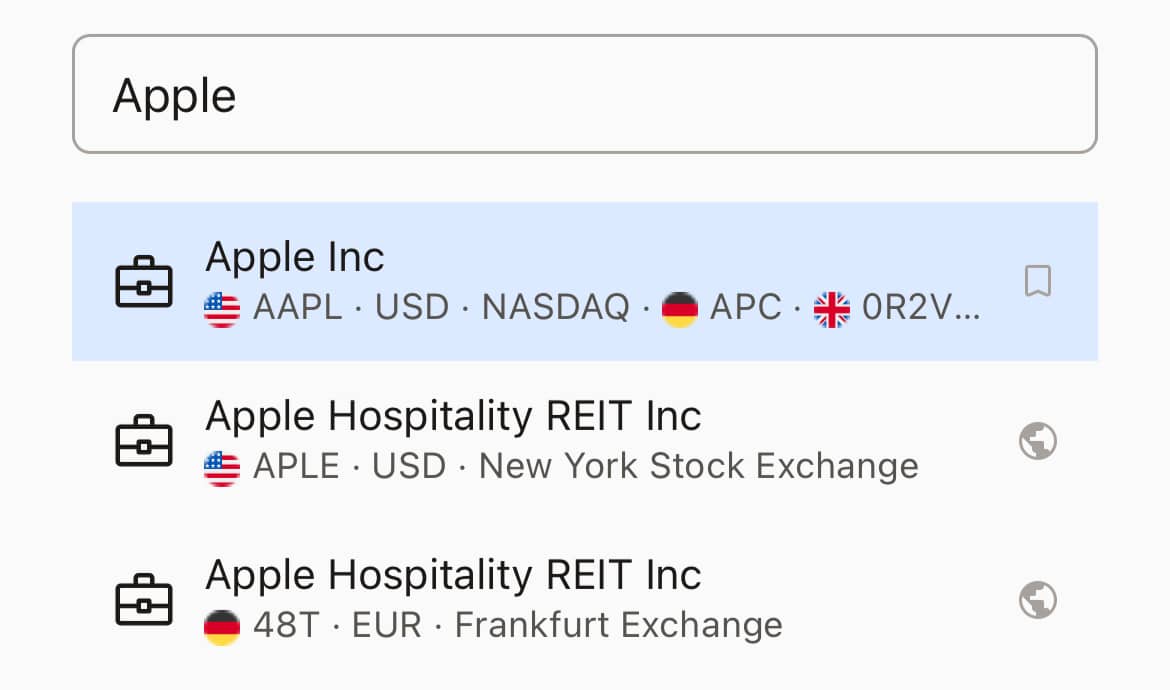
When searching for an asset symbol, you can now directly select the symbol and exchange from the list. Assets you already own will appear on a single line, as their symbols have already been selected. Should you need to change this, you have the option to edit the asset or create a custom one.
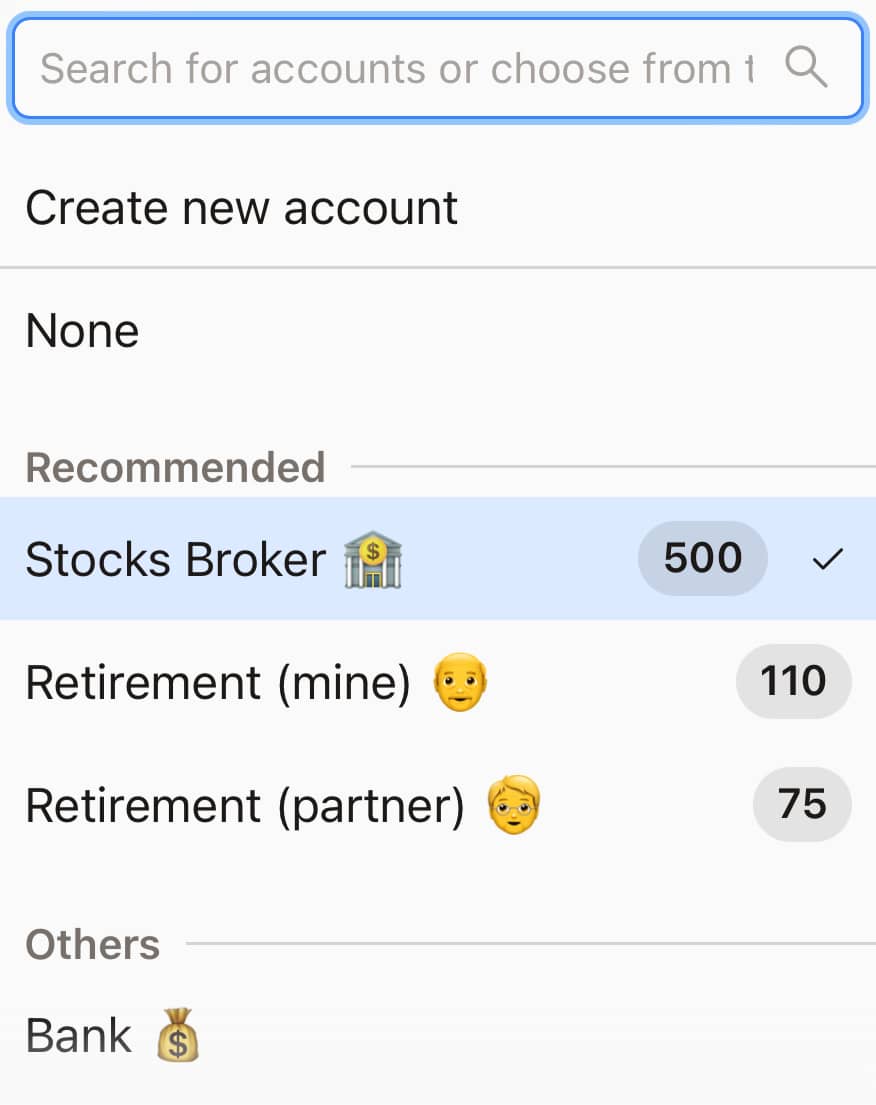
When adding a transaction manually, the system will automatically select the account with the most recent transaction involving that asset. Accounts that have held the asset in the past will be highlighted as recommended options, with the quantity and selected dates displayed on the badge.
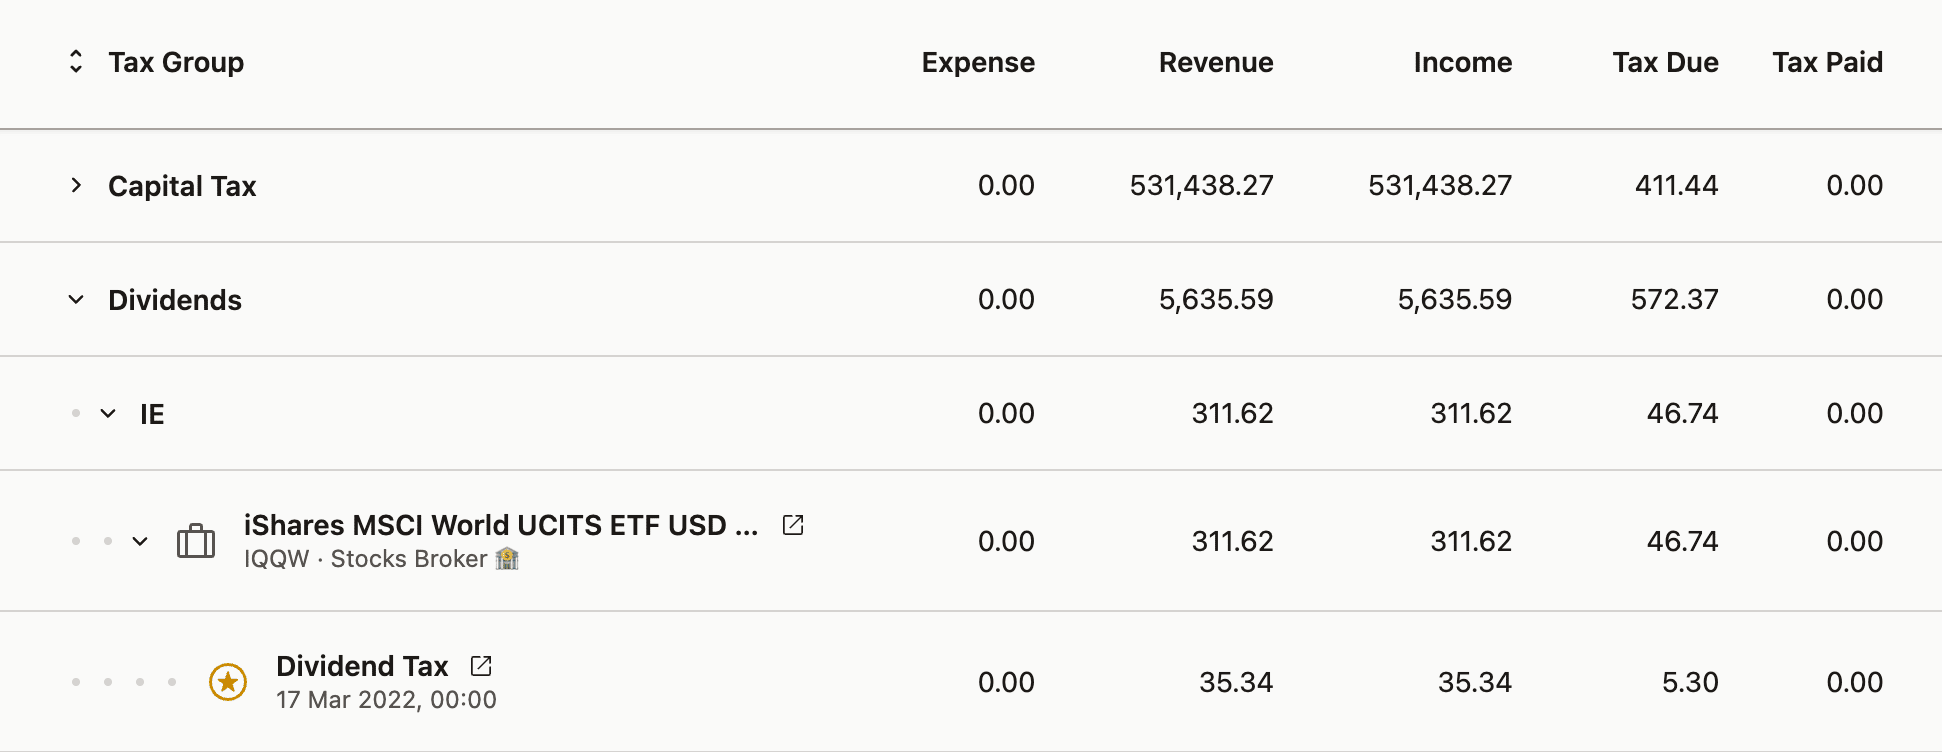
Full tax support has finally arrived, and it's incredibly flexible. You can model virtually any tax rule from around the world, including Capital Gains, Wealth Tax, Progressive Tax Rates, domicile differences, and more. Once you set up the Tax Presets, you'll get comprehensive tax reports, and you can analyze tax metrics just like any other metric in your portfolio.
This even includes Harvestable Tax, which estimates how much tax you could recover by selling some losing positions.
There are already early versions of presets for US, UK, Poland, Netherlands and Italy. If you need another one - you can create your own. You can get some inspiration from our walkthrough video or demo.
If you've made a preset you'd like to share or need a specific one to include, please let us know or checkout the newly created repository where we can collaborate on new additions!
And there's more
Every single notes field now supports text formatting. It works similarly to Notion: you can use
Ctrl/Cmd+Bto make the text bolder or type**bold**to do the same. By pasting a URL address over selected text, you can create a link.You can specify a country for accounts.
When editing a transaction, you can change its type.
Settings have been completely reorganized.
You can finally change your display name in your profile.
There's a new import template for Trading 212.
All of the app's internals have been greatly modified to allow for faster startup, smoother updates, and offline support.
If the app appears to be stuck loading, please reload it with Ctrl/Cmd+R or close and reopen the app. The first update might be a little bit bumpy due to the extent of changes 😬
This version introduces several enhancements based on recent updates, but it also addresses issues that were either caused or revealed by these updates.
All charts, tables, and summaries now employ the same calculation methods.
The Returns chart now shows the returns from the start of the selected period, rather than absolute returns. This change ensures consistency with the returns displayed in the Summary and the Table below.
All values and charts have been updated to correctly include the first day of the selected period. The value for the first day will seldom be zero, as it uses the previous day's data as the basis for calculation. This adjustment ensures that every day within the selected period is accounted for in a uniform manner.
Date pickers and dates should now function correctly across time zones that are significantly different from GMT, such as those in the US or Australia.
Unrealized returns will now properly exclude fees and be accounted only for the selected period.
Two new columns have been made available in the Portfolio section: 'Returns (1 year)' and 'Returns (max)', which can be added regardless of the period selected.
The transaction fields for Fees and Tax Paid will now accept negative values to account for situations where fees or taxes were adjusted at a later date.
You can now include capital, currency, and fixed returns in the Income Report if necessary.
Rows in expandable tables have improved indentation.
Group headers will no longer appear if all items within a group have been filtered out.
Split transactions are now visible again.
In some tax jurisdictions, you are required to use official Central Bank's foreign exchange rates. To complicate it further, you may be required to use a different date than the transaction date to get the rate ( 🇵🇱 👀 ).
Both are now possible in Capitally! Just type EUR.CB, NOK.CB or PLN.CB when selecting a currency and you will see all the numbers using the official rates.
In the Taxable Income Report you can additionally choose the Currency Date Offset.

This update is huge! So much has changed that it feels almost like a 2.0 version. Let's dive into the new features then!
Income Report
Tax season is almost upon us, so it's high time for Capitally to offer proper assistance. Although full tax support is still in development, we've added a new Reports section where you can quickly review your current open positions, as well as returns from closed ones and fixed income.
The Explorer has been renamed to Portfolio and features a brand-new table
The new table not only looks much better but also includes several handy new features:
Positions can now be expanded to show lots, allowing you to view the returns from each purchase separately. When you navigate to an asset, you can see the individual lots.
Accounts can now be expanded to display positions.
Taxonomy trees are also expandable, enabling you to view the entire tree in one place.
A totals row has been added.
There is a Dense view option for fitting more rows on a single screen.
When sorting by a numeric value, rows are organized into buckets.
The column picker has been streamlined for easier navigation, with columns now grouped by category. This eliminates the need to reorder them, and you can toggle a column across all views at once with the
Apply changes everywherebutton.The Returns and Asset Price columns now display the rate of return and a price trend, respectively.
The Invested Principal column indicates the change within a period, making it easier to track how much you've adjusted your position during that time.
All "Total *" metrics have been removed due to performance issues and limited benefits. You can still view totals by setting the "max" or using the new "hold" period.
The "Pairs (FIFO)" tab has been eliminated, with all relevant information now accessible in the Income Report.
Lastly, the Transaction Balance column now reflects the balance after the transaction, rather than before as it previously did.
Print and Export tables
All tables are now printer-friendly. Simply press Ctrl/Cmd+P or use the new export button to print or create a PDF for your records or tax accountant. From the same menu, you can also copy the data or generate a CSV or XLS file.
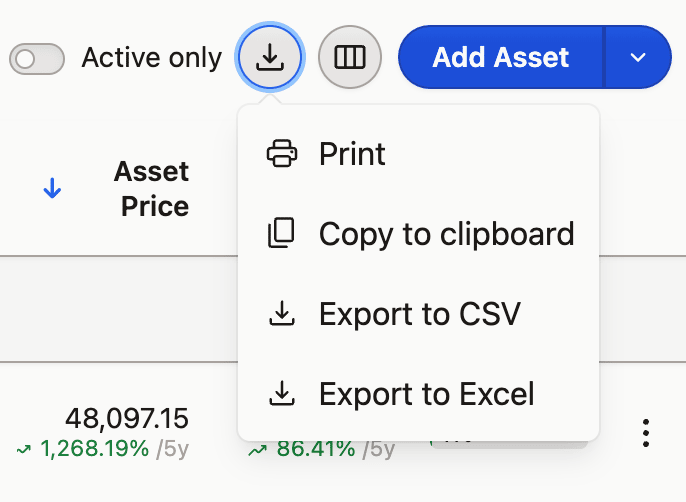
All exported versions will include the columns you've enabled and only the rows that are visible, allowing you to control the amount of data you wish to include.
Positions, Lots and Units...
There's some new terminology to familiarize yourself with:
Position Units - Units represent the smallest segment of a position, determined by an opening transaction and, optionally, a closing one. A partial sale will split the unit into two parts: a closed unit and the remaining open unit. These were previously referred to as "Pairs."
Transaction Lots - Lots consist of all units that were opened by the same transaction. Each time you make a purchase, you open a Lot. If you sell part of this Lot, that portion is considered closed.
Position - A Position is the aggregation of all units of the same Asset within the same Account. It reflects the total amount you hold of a particular Asset in a specific Account.
New look & feel
All icons have been updated with lighter, crisper versions. The buttons have been given a bit more depth to enhance visibility. The highlights have been made more subdued. And the table now finally resembles a proper table, with all numbers aligned to the right, maintaining a consistent two-digit minimum precision for currencies, and column widths adjusted to fit the content.
To accommodate the Reports section on mobile devices, the Add button has been removed from the menu bar. However, it remains accessible from the context menu in the Portfolio section.
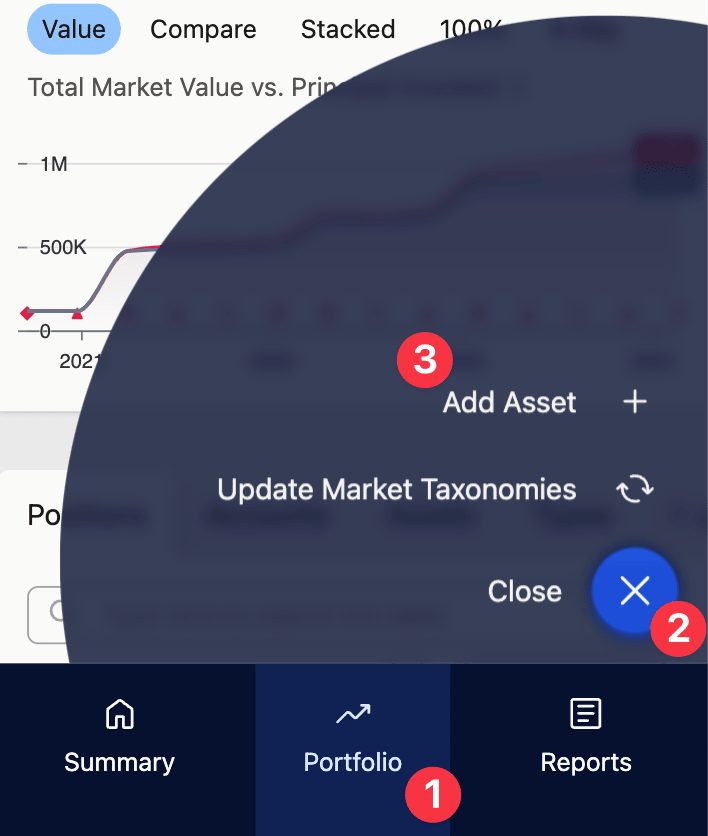
Since the context menu includes options that are directly available as buttons on the desktop version, it is now only visible on mobile devices.
Additional periods to choose from
You now have the option to use additional time periods:
holdwill apply the holding period of whatever you are viewing. It is similar tomax, butholdends when you closed all positions (or today if they are still open).qtdstands for Quarter to Date, which is similar tomtd(Month to Date) andytd(Year to Date).1qrepresents one quarter ago.-6m +6m(or simply6m 6m) selects a time frame of 6 months before and 6 months after the current date.
Additionally, all charts will now consistently use the same time period you select.
And more...
There's a lot of other changes under the hood that enable some awesome future updates. As always, there is also a host of minor bug fixes and quality improvements.
New Explorer metrics
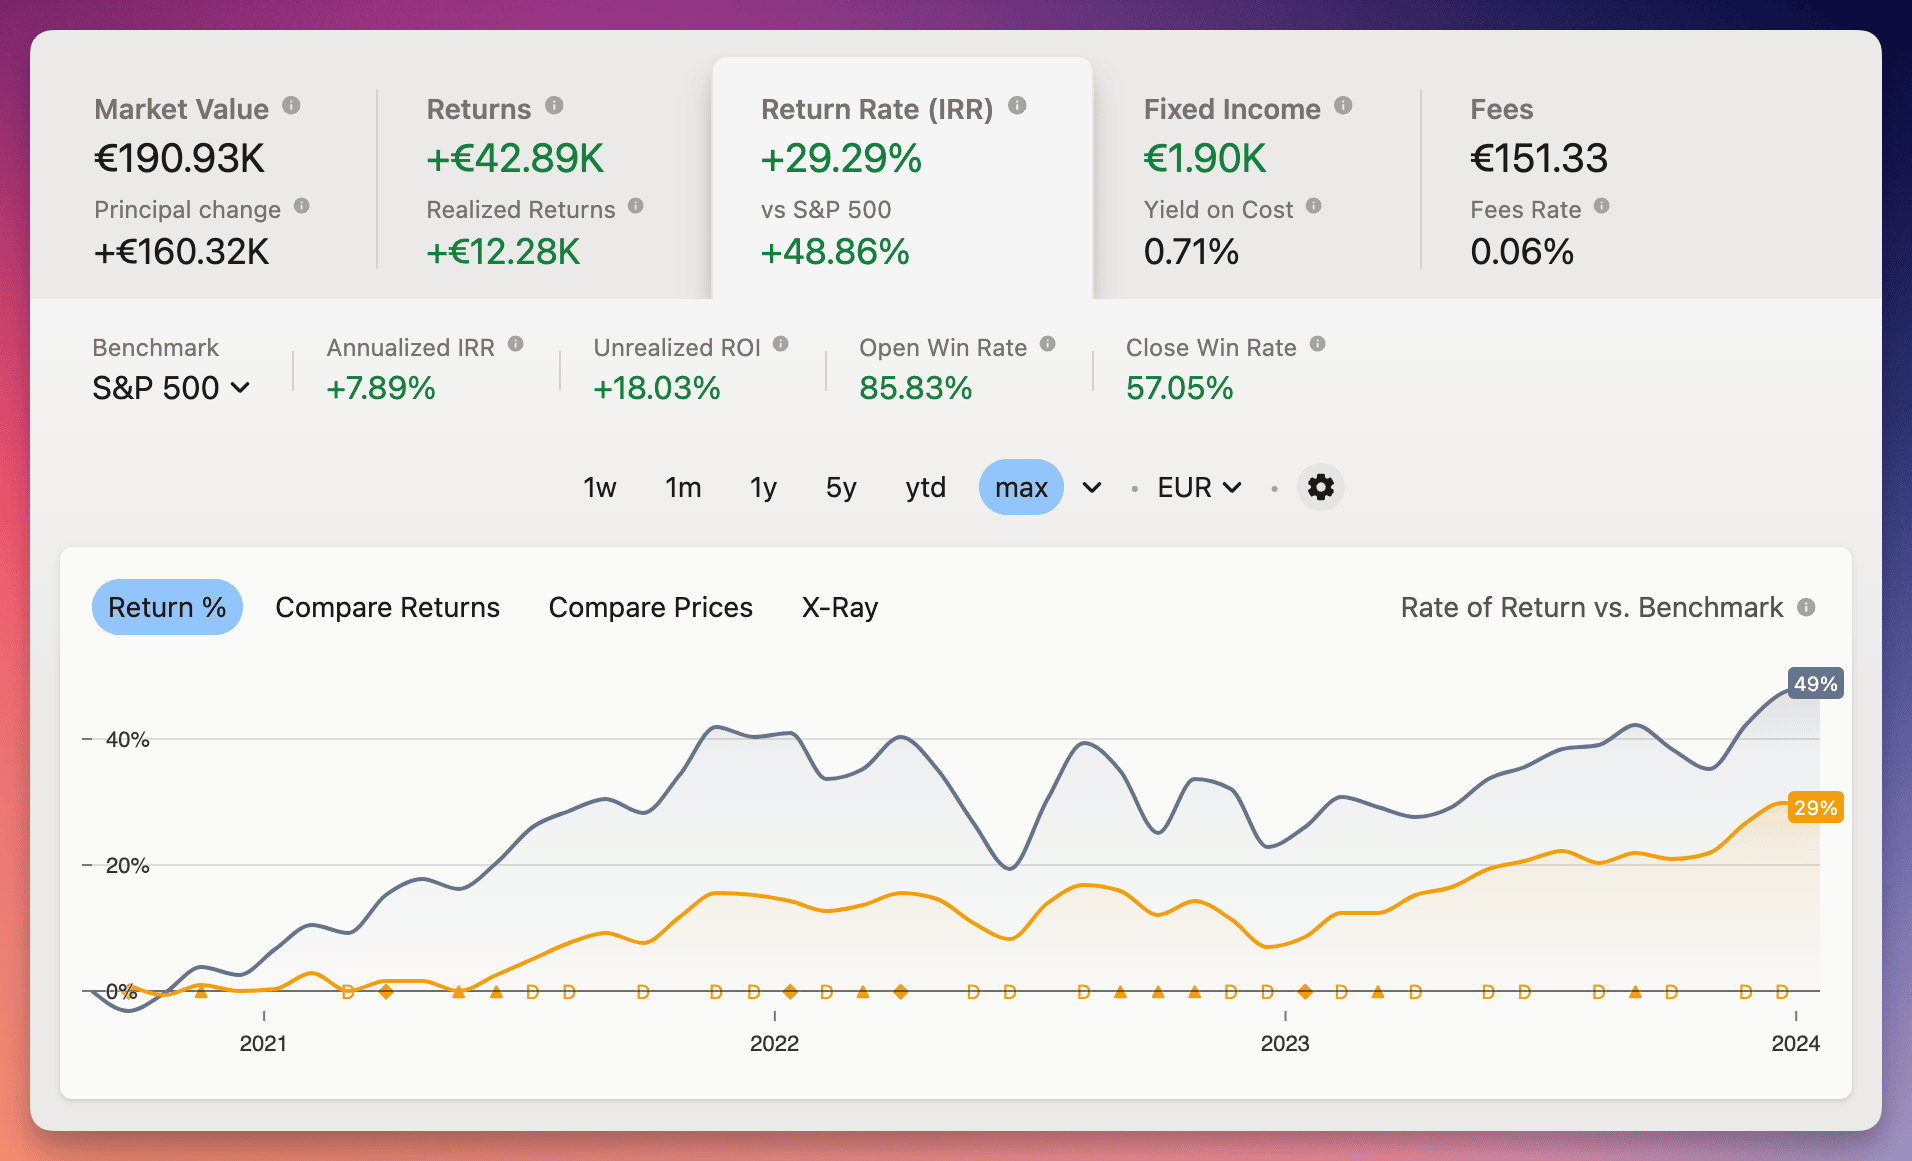
Each metric tab will now display additional related metrics when you activate it. Among them are completely new ones like:
Average Asset Buy Price, also available on the asset's price chart
Unrealized Returns and their ROI - showing returns of currently opened positions
Open & Close Win Rates - what part of your currently opened or closed investments brought profit?
Fixed Income per Month and Day - how close are you to a salary sponsored by fixed income?
Fees broken down into cost of opening, closing, fixed-income and other
New Period selector
Switching time periods should be quick and easy. With the new selector you can pick one of the predefined periods, type in yours (eg. 2020 : 2023, 2020-06 : ytd, 2023-12), or choose with a date-picker. Then, you can quickly compare year-to-year or period-to-period by jumping back and forth with +/-1 buttons.
Finally, you can pin the ones you need most often to see them directly in the Explorer and Summary. And yes, YTD & MTD have finally arrived as well!
Returns calculation options
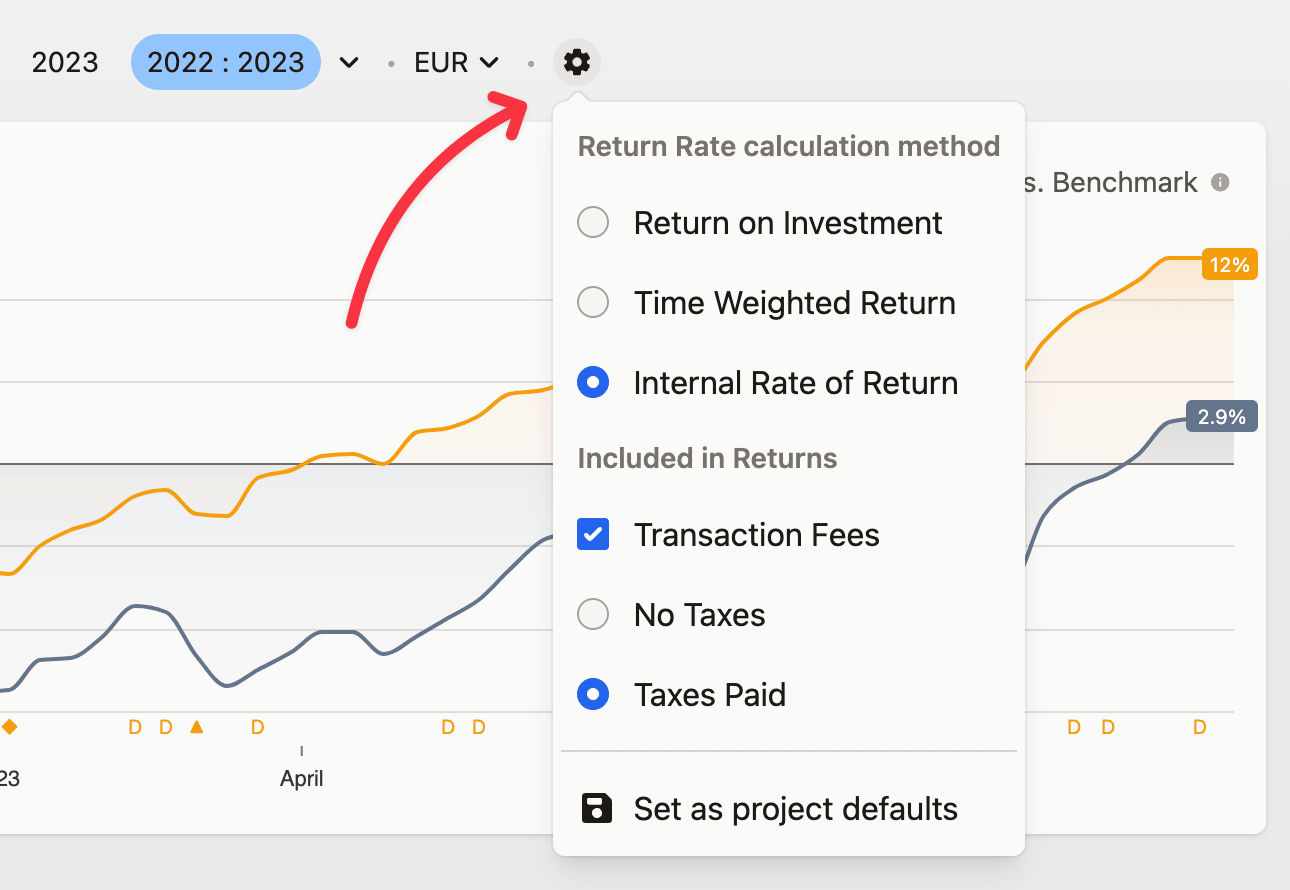
Everybody understands returns a little bit differently and now you can tweak how Capitally calculates them. You can choose the method and whether fees and taxes should be included. The options are available under the Cog icon next to the currency selector. You can change them just for one Explorer session or set as defaults for the project, so Summary will also use them.
And if you're looking for the benchmark selector in Explorer - it's now moved to the second row under Return Rate tab.
And more...
Fixed Income Yield on Cost is now more accurate
Assets will have Domicile Country defined in their taxonomies (handy for upcoming taxes!)
You can add the
Cashflowcolumn to the Transactions table if you want to see how much money you've put in or out within a transaction (includes cost/revenue, fees and tax paid)Some asset's prices where not updating for the past week - sorry for that!
Ever wondered actually how much you gain/loose from exposure to foreign currencies? Wonder no more. Capitally has now two additional columns - Capital Returns and Currency Returns which you can add to the table, plus you can check them broken down into sub-periods - just head over to Returns and choose the Periods chart.
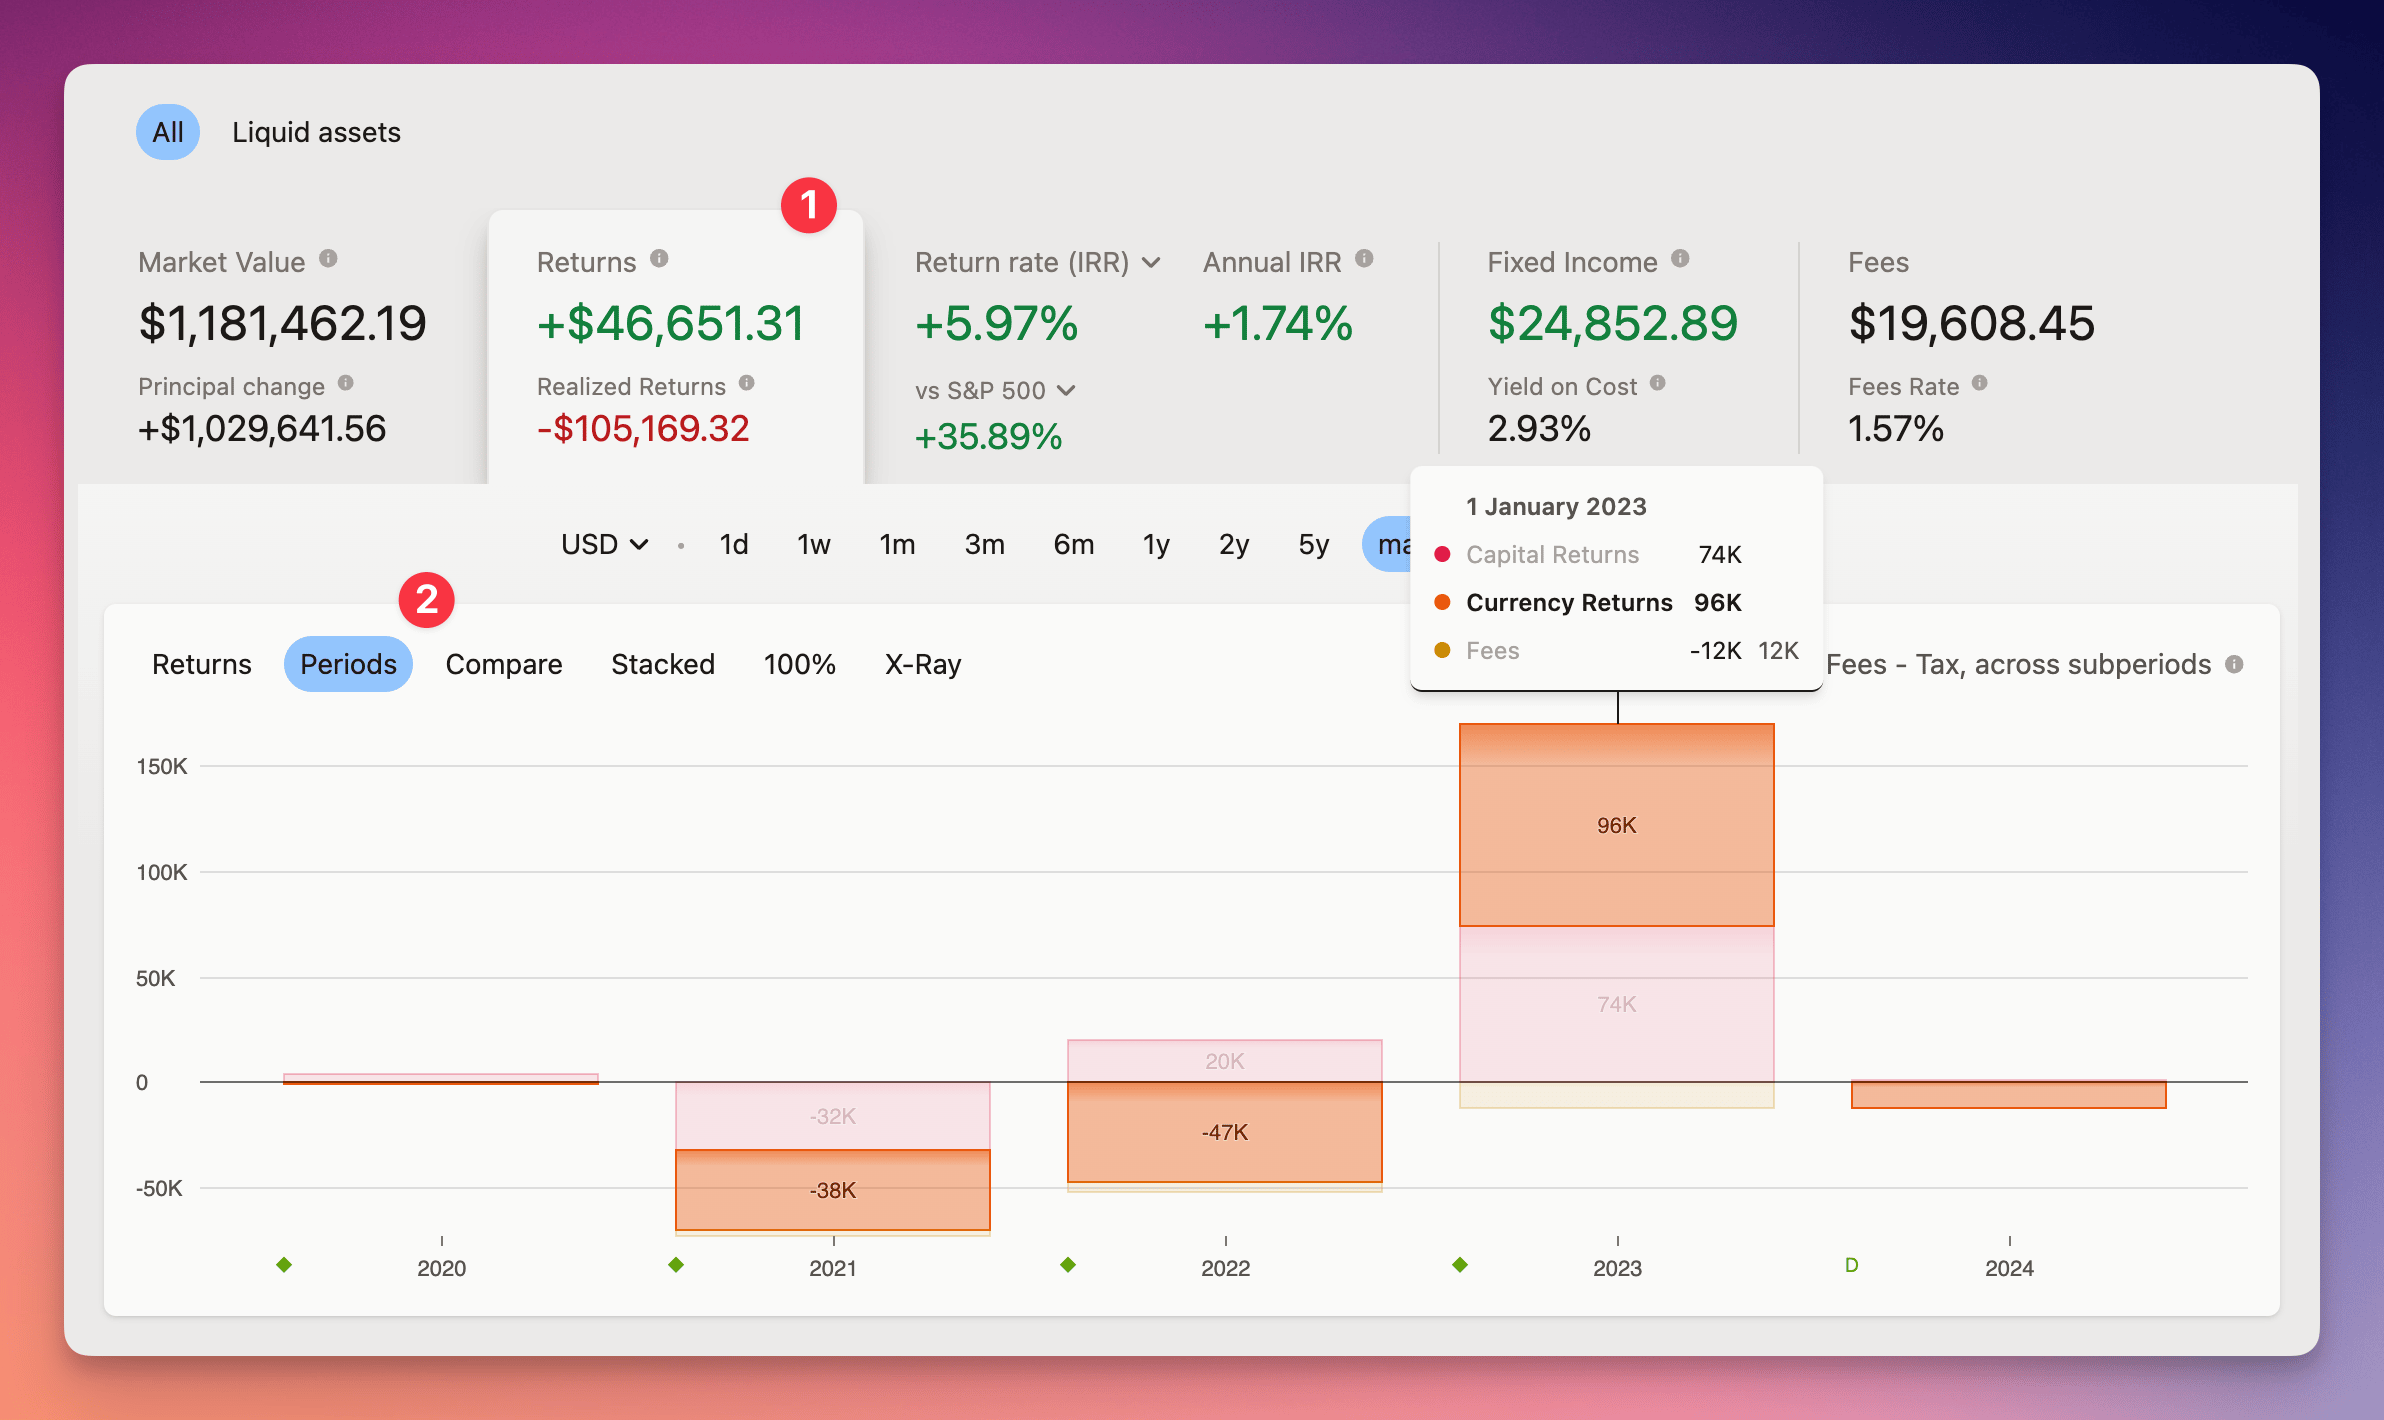
Plus in preparation for the upcoming taxes support, you can now add Tax Paid to your transactions, to log taxes withheld from your returns by the broker.
We're kicking off the year with some serious performance improvements for larger projects.
If you have a large number of assets or transactions, you should see a big difference in how fast the prices are loaded and how quickly you can navigate across pages. 🚀
A lot of small improvements have been released today along with bigger, invisible groundworks needed for better market symbols support. You're asking for a lot of new ISINs to be added (keep them coming! 🤩). As reindexing them is a painful process we're aiming to change that.
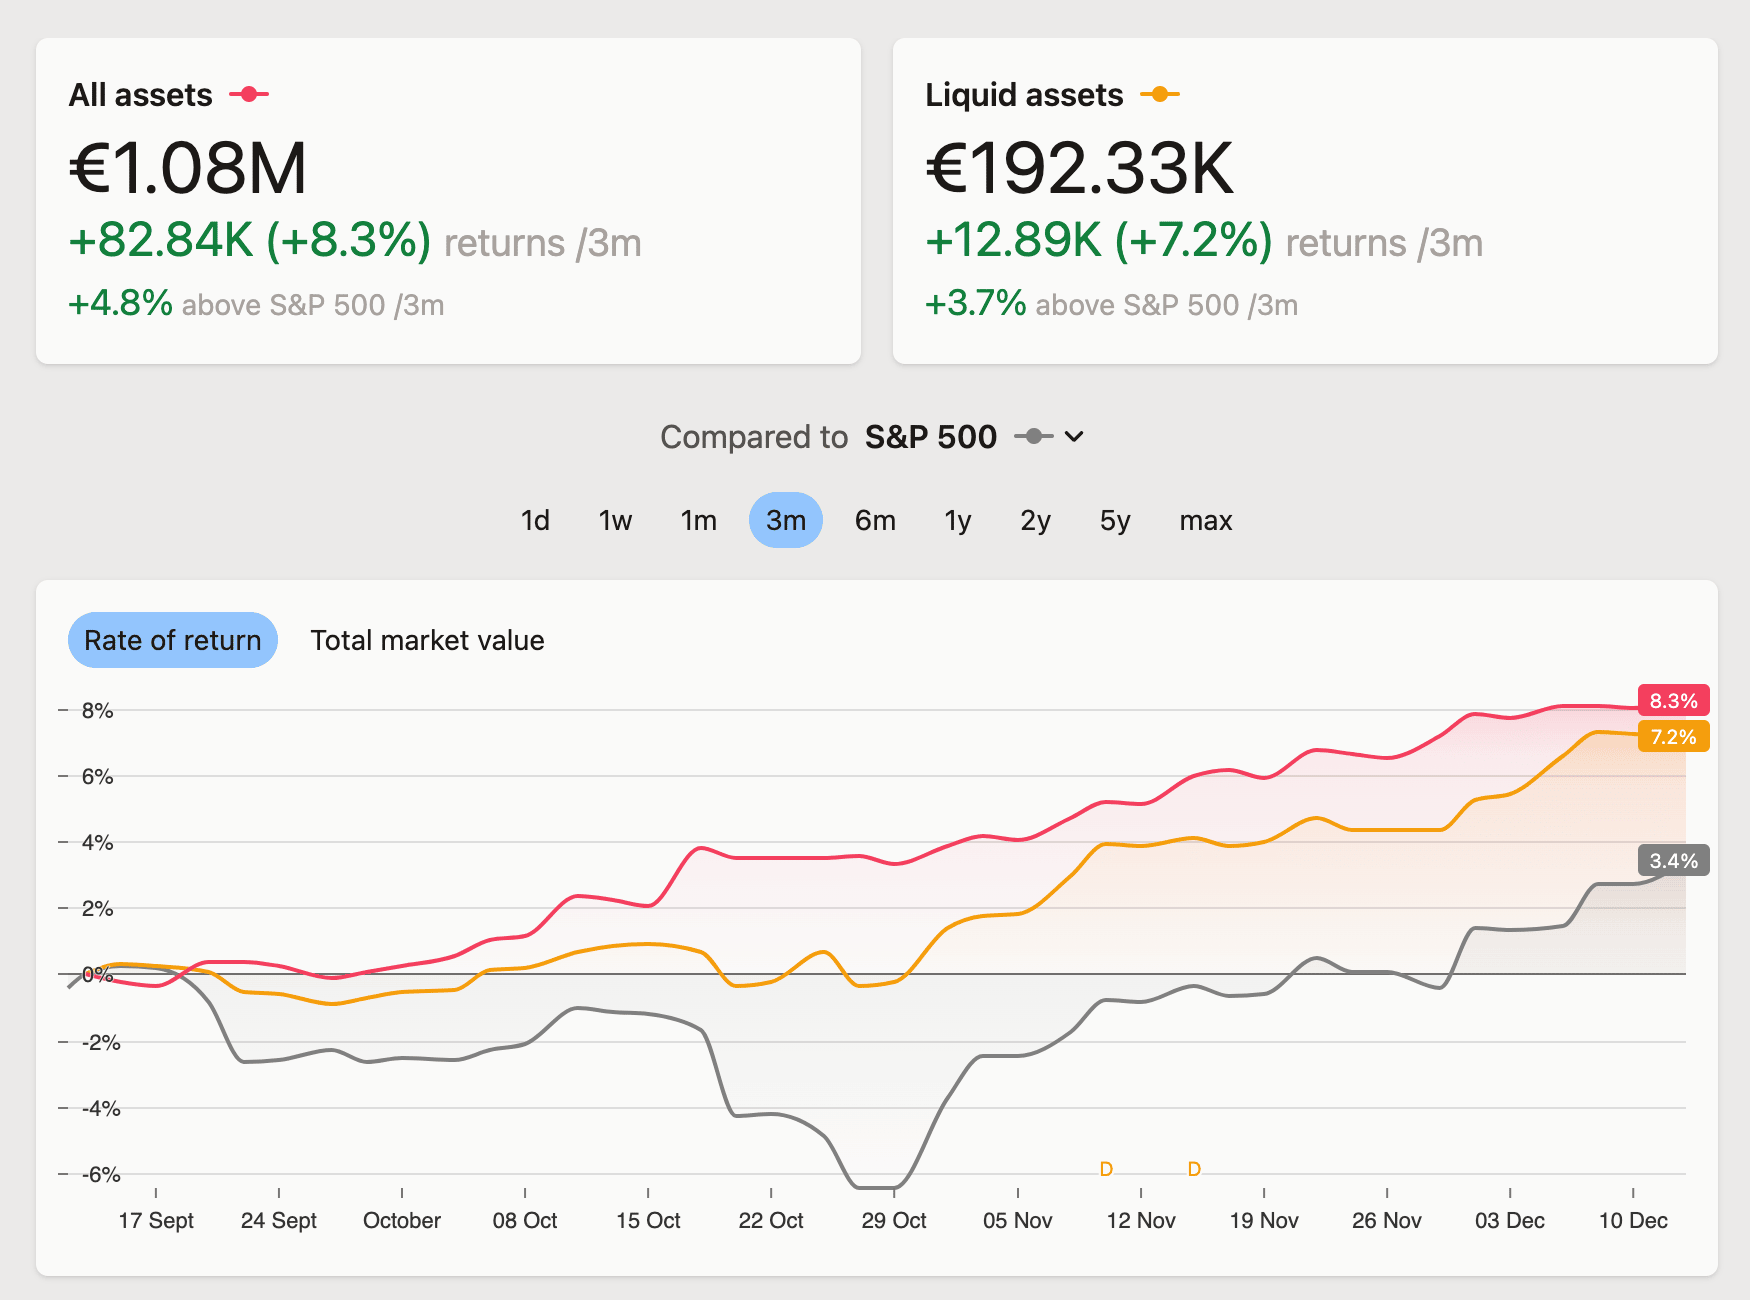
Line graphs display the last value in a label for quick visual confirmation.
Nested taxonomies will have a separate breadcrumb for each level for quicker navigation.
Back button will only be displayed in installed apps - in browsers you can use the built-in one.
Summary layout has been cleaned up a little bit, with the default Benchmark set to SPY 500.
Transactions can now use dates as early as year 1950. Our currency data is currently limited to last 25 years, but if your transaction and asset are in Project's currency - you should be good to go.
Logging in should now be a little bit faster.
A Reset prices cache has been added to user profile - you can use it in rare cases where our data provider corrects historical price data.
Issues with exporting data and remote keys are now resolved.
Improved Price Handling for Unlisted Assets: When there's no market price available for a certain date (for example, for pre-IPO or custom assets), Capitally will now use the price from your BUY or SELL transaction by default. Remember, you can still manually input a different market price at any time.
Refined Asset Search: You should encounter delisted symbols less frequently when searching for assets. Plus, both delisted symbols and assets will now be clearly marked in search results and the explorer.
Expanded Symbols and Taxonomies: We've added a plethora of new symbols and taxonomies. If you've noticed any missing from your portfolio, now's a good time to refresh and see the updates.
Improved Import Templates: Schwab, XTB, eMakler, and Bossa.
And some more minor enhancements and fixes...
Say hello to a new way to organise your investments 👋 - taxonomies group your assets by categories, regions, and sectors. They're pretty flexible, so you can adjust or add to these groupings to match how you think about your portfolio. And, of course, you can organize any custom assets you've added in the same way.
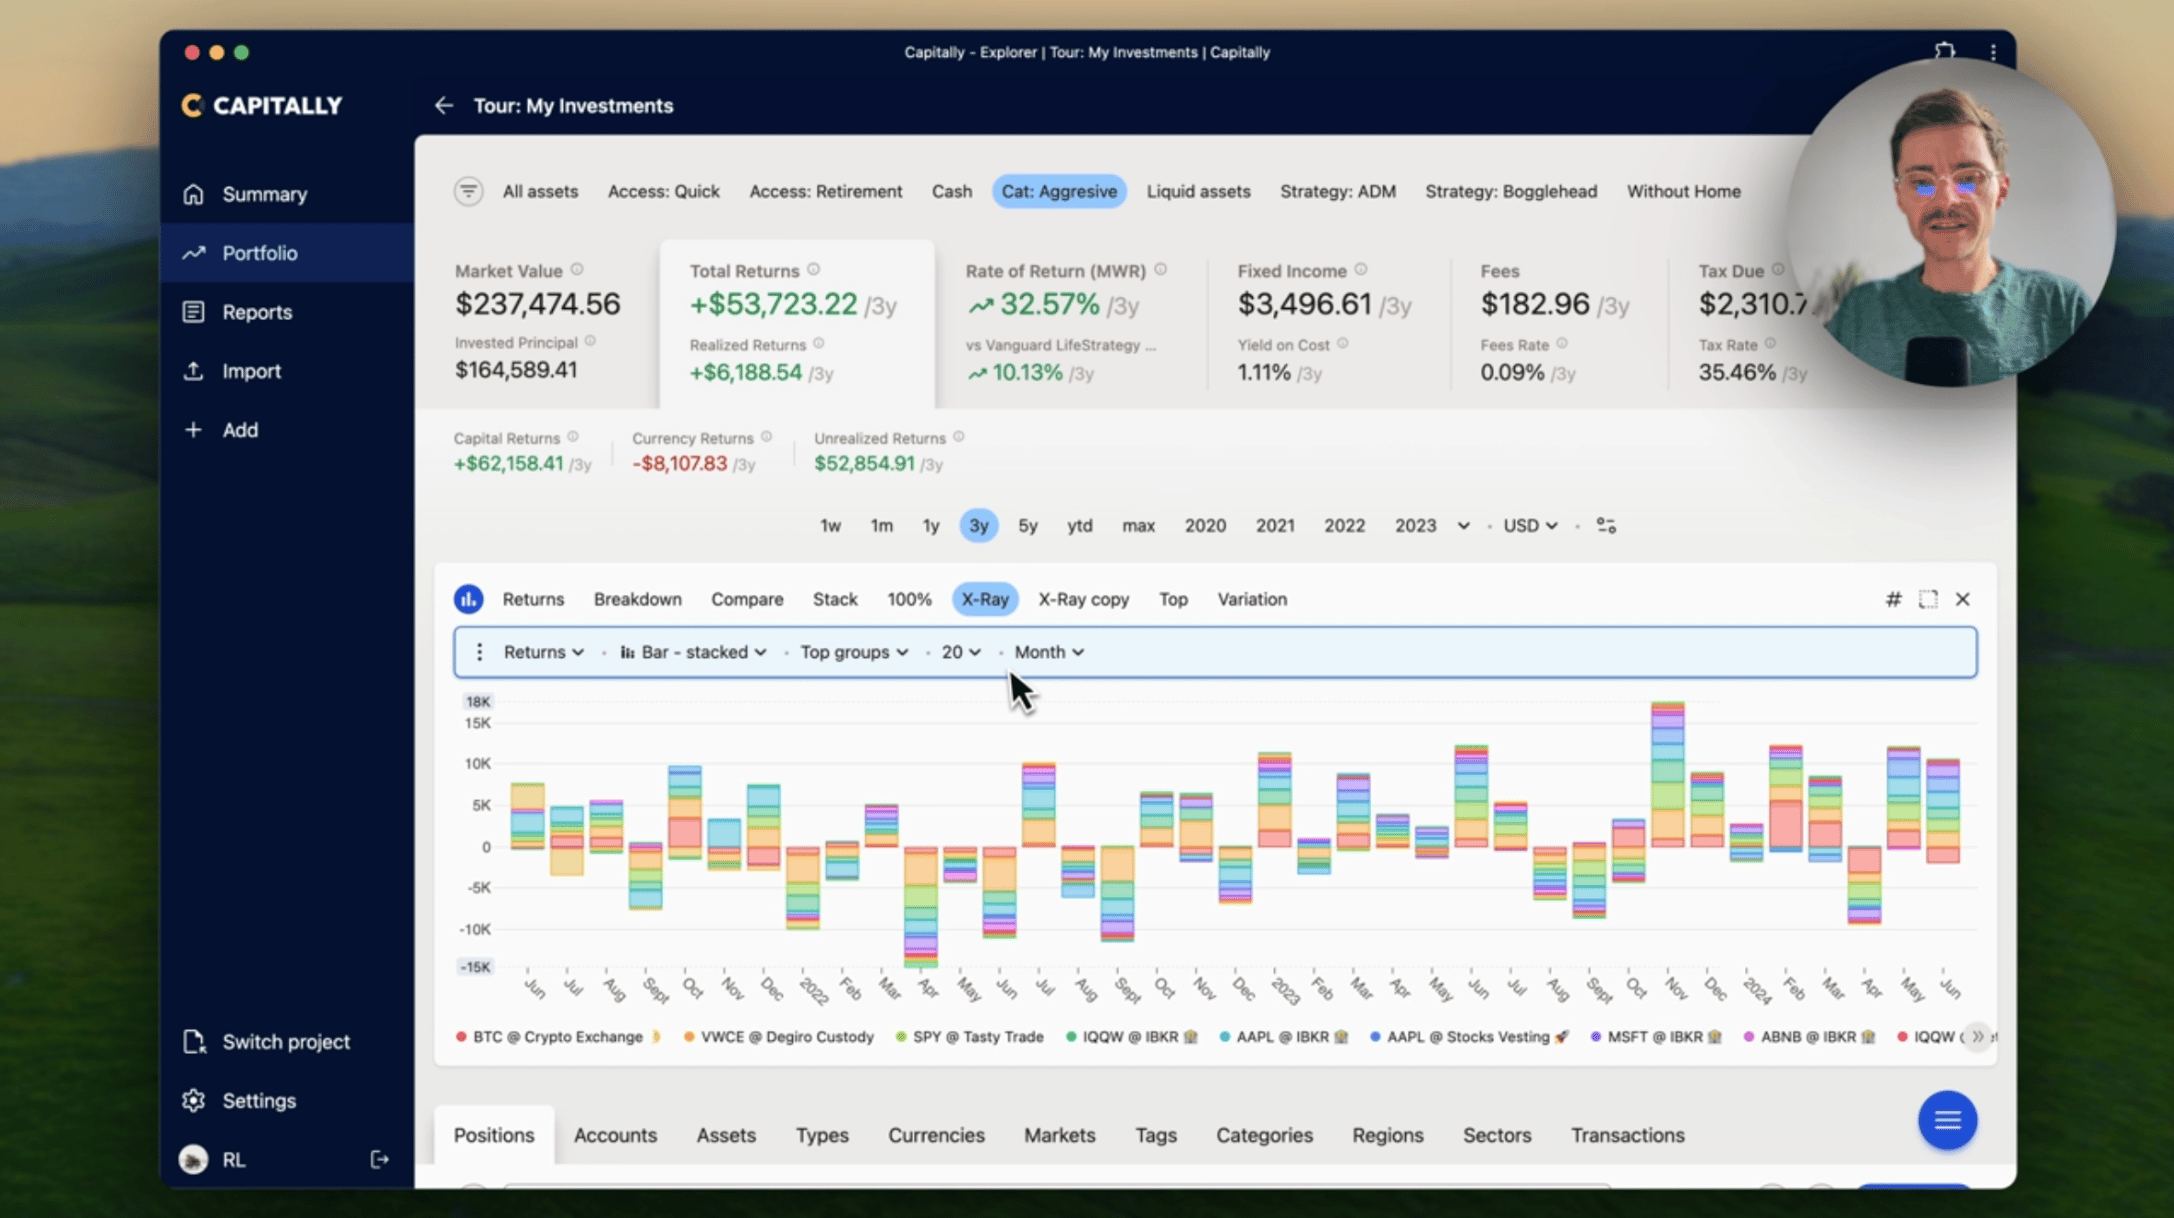
To tie it all together, there's a new X-Ray chart that gives you a visual breakdown of your investments. You'll be able to see at a glance how your assets are spread across different regions, categories, accounts or any group you choose. It's kind of like having a map of your portfolio and it works with portfolios of any size. Plus, this chart works with all sorts of metrics, so whether you're looking at returns, allocation, or fixed income, you'll get a detailed picture.
Lear more about taxonomies.
When importing or adding new assets, it's now possible to quickly select an exact Market Symbol you want to use. By default, we'll pick the one with the longest history and highest quality of data, but if you want to track a specific one, here's what you can do:
Type in the market symbol with all UPPER CASE letters. You can add a market suffix to be more specific. Your market symbol will show up first on the list.
When importing from a broker, match the Symbol column instead of the ISIN for Assets
And/or click the ✏ icon in the asset dropdown to edit the asset however you need (or just verify the price chart).
Not all market symbols will currently have full Dividends & Splits information! Remember, that you can change the market symbol at any time.
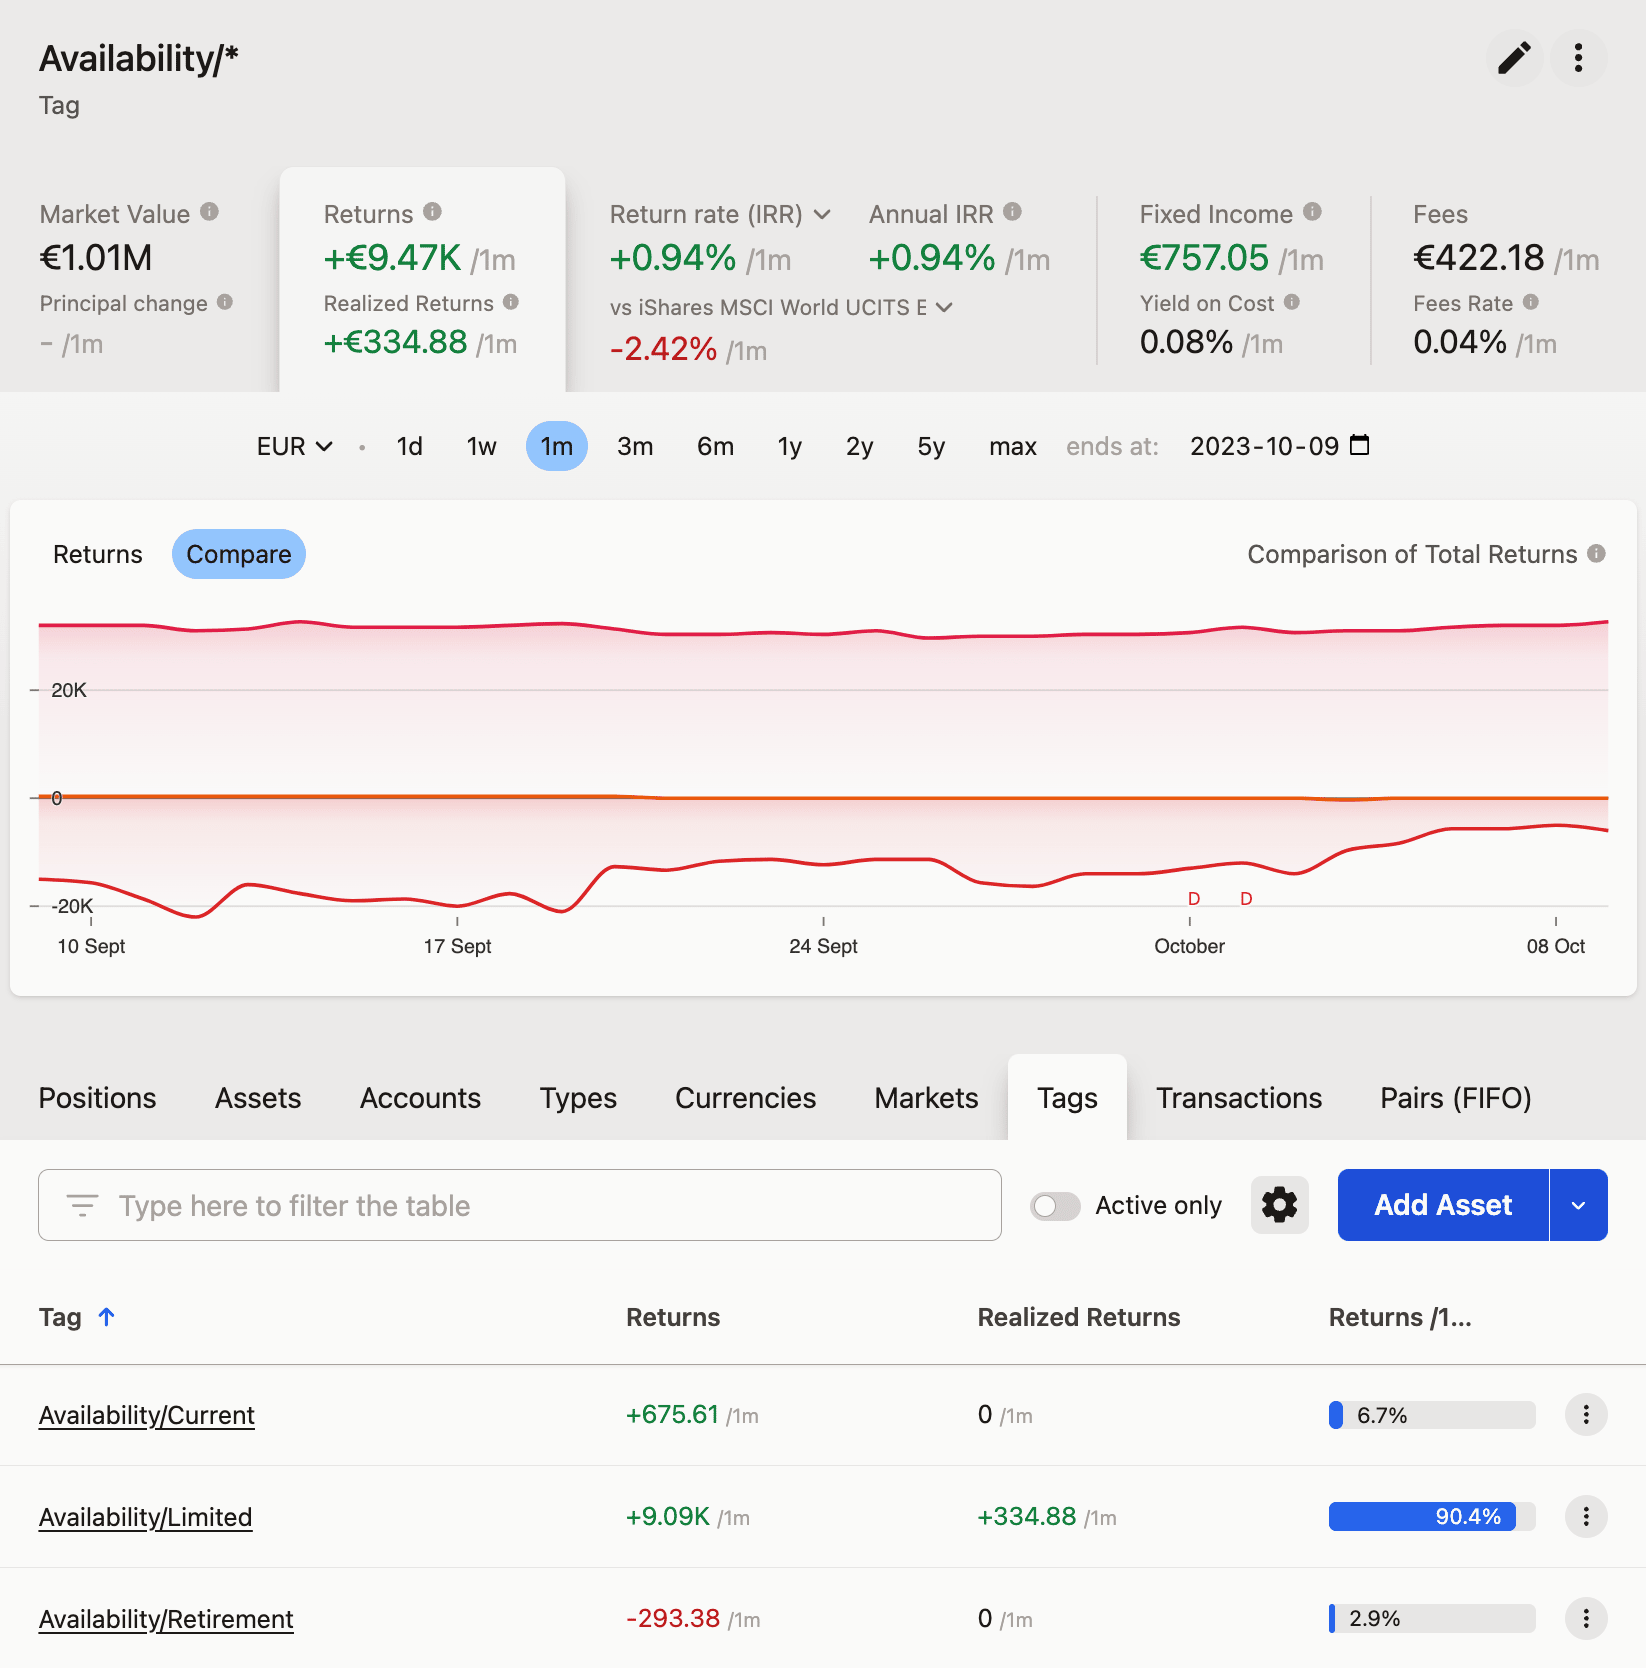
You can now organize your portfolio by tagging Assets, Accounts and Transactions with hierarchical tags! As Transactions inherit the tags of their Asset & Account, it allows for a truly robust categorization, like asset ownership (down to a single unit), availability, timing or anything you require.
Read more about tags in their help article or check them out in the demo.
It's now possible to sign-in using a Google account (for new users only).
As we're using the User Password to encrypt the data, we've added a new encryption method for passwordles accounts that retrieves the encryption key from our server (stored separately from data). One advantage of this method is that you won't loose access to your data, even if you forget your password and loose your device. You can change your encryption in the Project's settings.

You can now get a summary of your portfolio's performance delivered daily, weekly, or monthly to both your desktop and mobile devices.
You can choose which day of the week or the specific time you wish to receive them to seamlessly blend with your routine.
And as with everything in Capitally, all calculations are done on your device, ensuring your financial data remains completely private.
To get started, head over to Project Settings and enable Notifications!

We've added help articles and guides, ready for you right within the app or via this link.
Along with a usual side of bug fixes and improvements (released throughout the month):
Templates for StockMarketEye & Fidelity
Market prices for thousands of US & EU mutual funds
More market symbol suffixes for more accurate searching
Added current totals to tooltips in Explorer metric tabs
Aggregated Yield on Cost should now be accurate (cost-basis was incorrectly weighted if multiple different assets where involved)
Fixes to imports, benchmarks, explorer exports, asset editing and more
We optimized how Capitally handles live market prices, so now your investments will update quicker than ever.
Our closed beta is wrapping up, and we're thrilled to announce that Capitally is transitioning to a paid subscription model. This allows us to keep improving the app and provide awesome new features. There's a 14-day free trial, so there's ample time to try it out. For a limited time period the price is just €5/month or €50/year + tax. Plus all users who joined the beta can expect a thank-you discount code arriving in their inboxes soon!
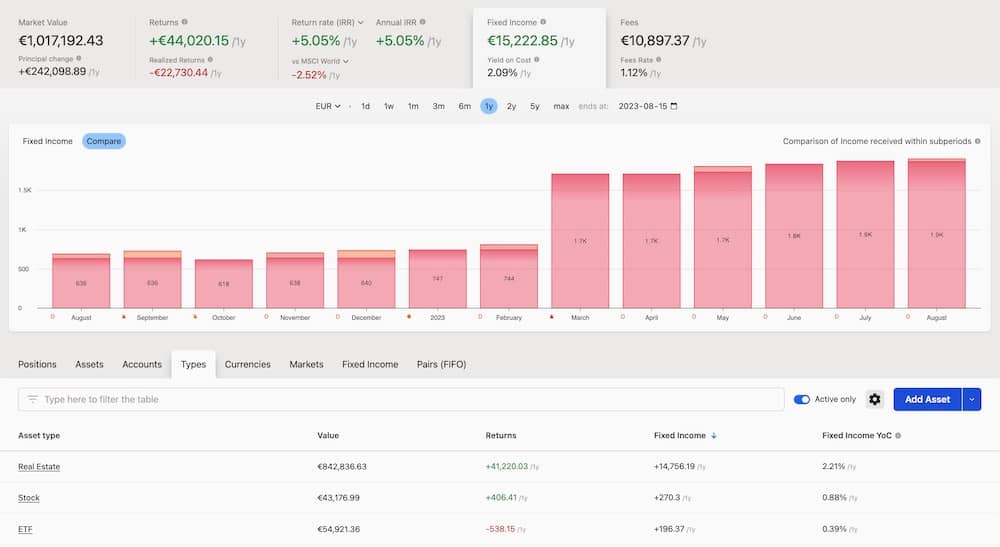
Fixed Income
Diversifying your income just got a whole lot easier. Capitally now boasts its own Fixed Income section, allowing you to easily track and compare dividends, including rent returns on Real Estate and Bond interests. It's not only about market price anymore!
Explorer Filtering
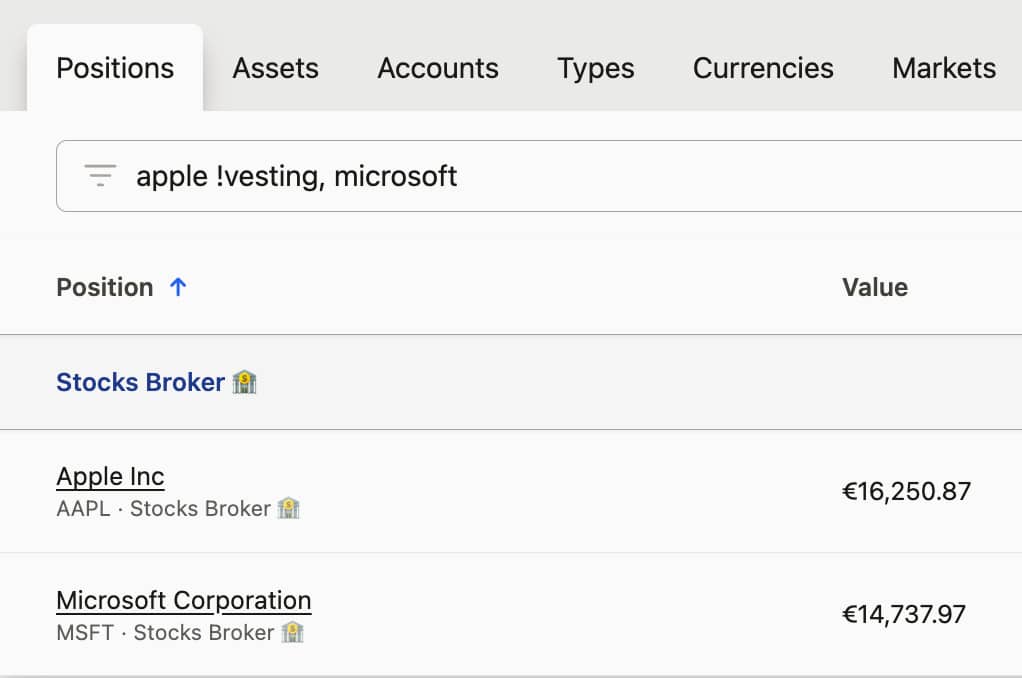
Using a field above the Explorer table, you can now filter by typing. Items filtered out won’t be displayed in graphs and metrics, helping to narrow your focus faster. Want to match multiple different things? Use a comma (like "apple, microsoft"). To exclude a word, use an exclamation mark (like "etf !bond"). It’s that simple.
Custom Benchmarks
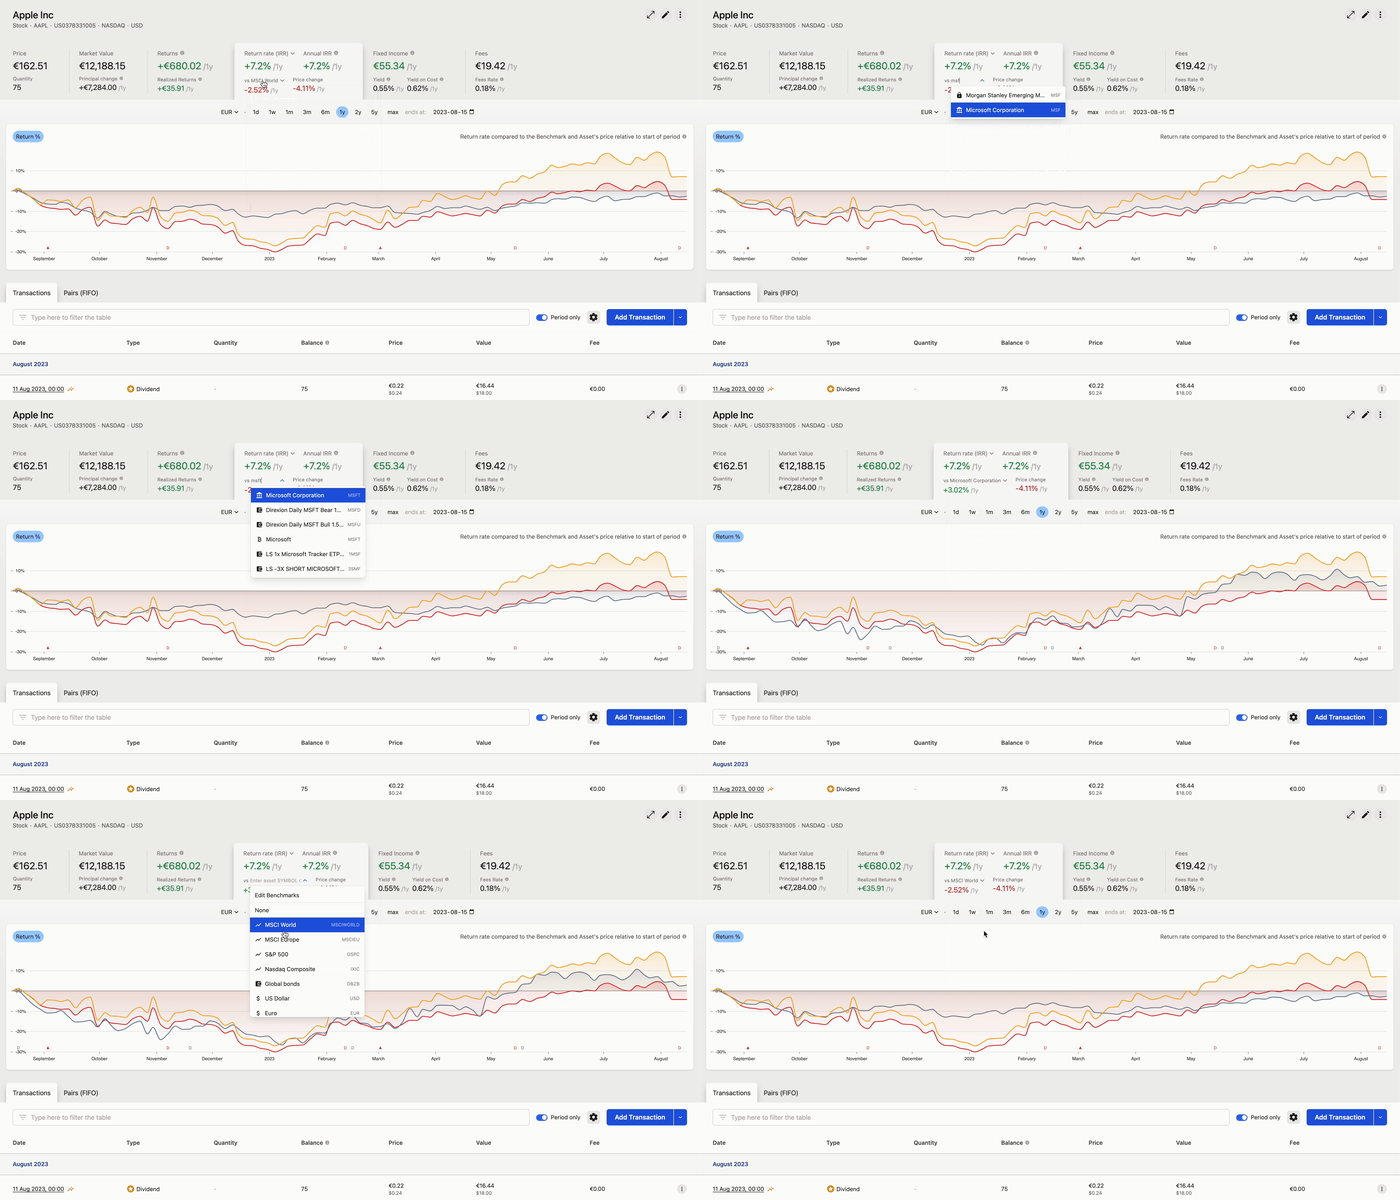
You can now use any asset - either owned by you or market-traded - as your benchmark. All you need to do is type its name when selecting a benchmark, and it's done.
Explorer Column Editing
The personalisation doesn't stop there! Explorer tables allow you to select and rearrange columns according to your preference.

New Explorer UI
Lastly, Explore section's UI is completely redesigned. It's now more readable, organized, and overall a smoother experience. I think you'll love it
