Multiple benchmarks, position-prices benchmark, and simpler date pickers
Compare against multiple benchmarks
You can now select up to 10 benchmarks at once and see them together on your charts and metrics. Previously you had to pick one and switch between them — now they sit side by side, so you can compare your portfolio against, say, the S&P 500, MSCI World, and one of your strategies in a single view.
A "what if I hadn't traded?" benchmark
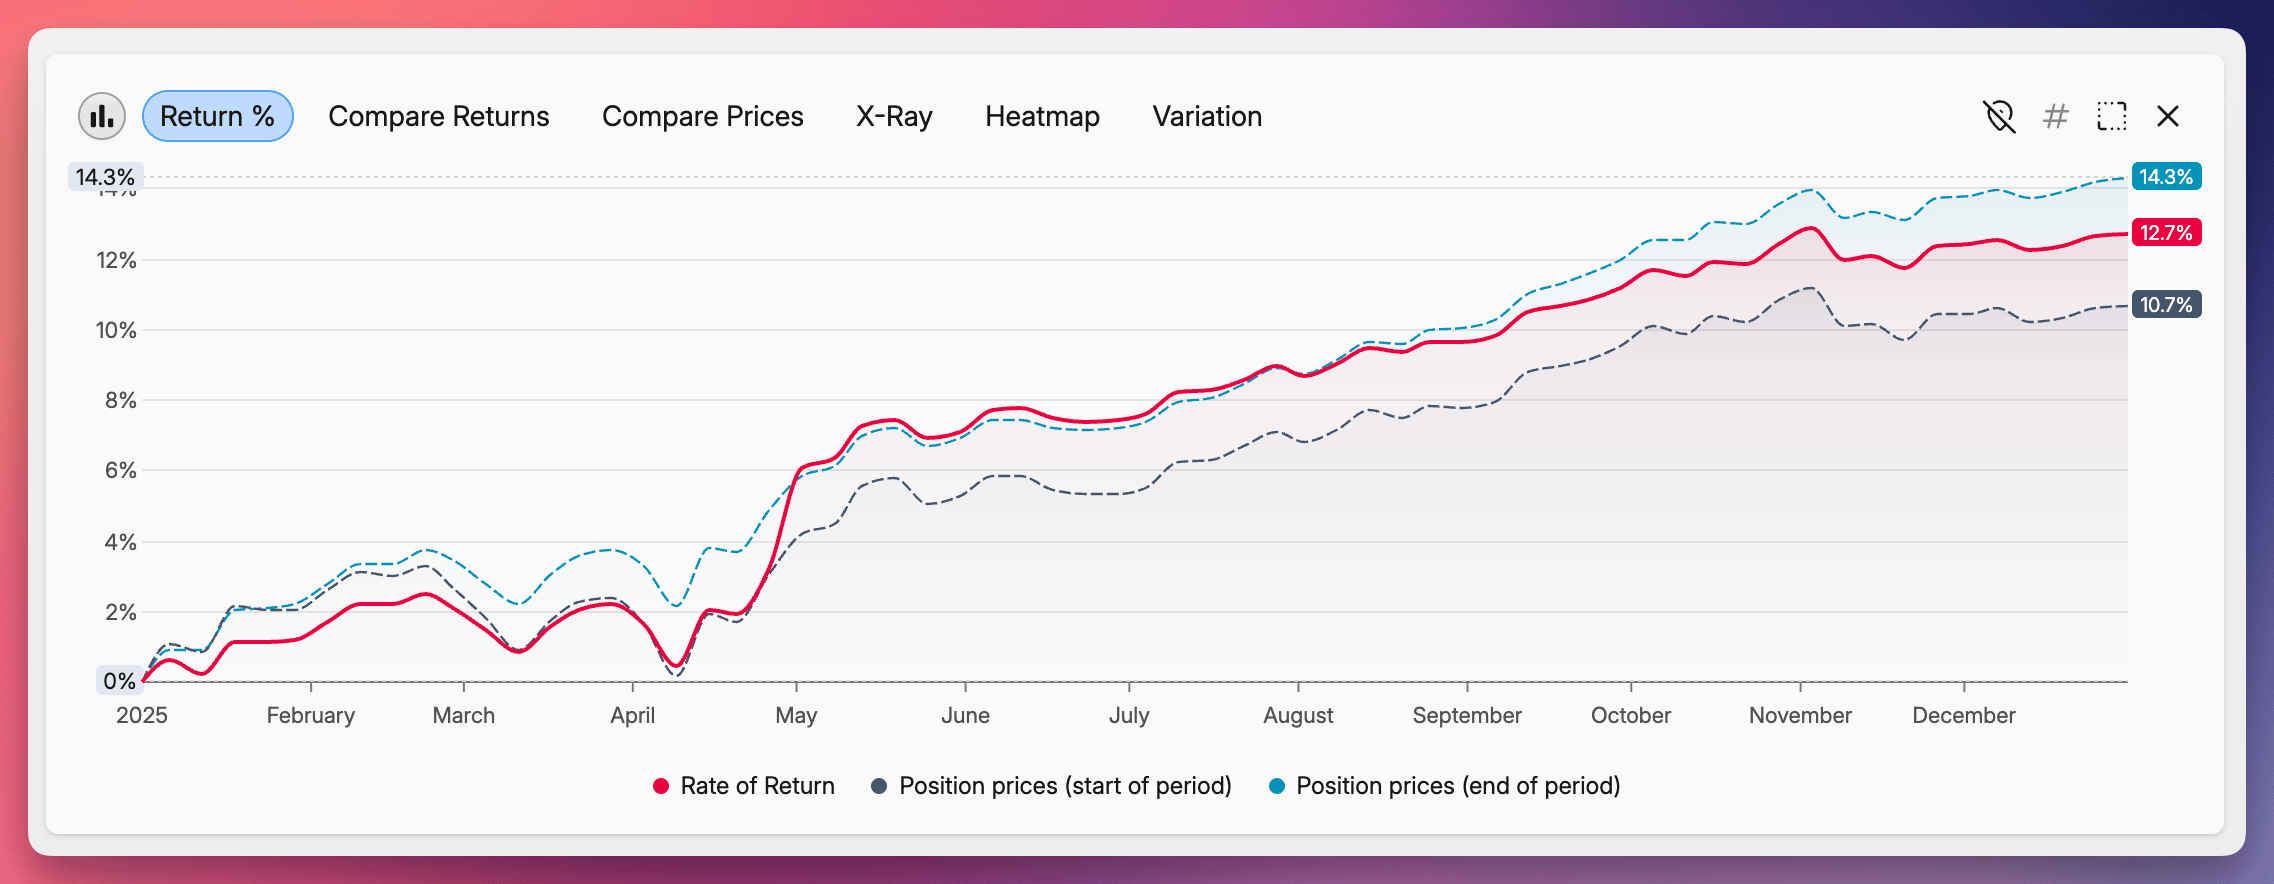
Position prices benchmark computes the return of a hypothetical version of your portfolio that holds a fixed allocation throughout the period — no buying, no selling. Compared against your actual return, it isolates the effect of your trading activity.
You can choose which allocation to hold constant:
- Position prices (start of period) — keeps the allocation you actually had at the start of the selected period
- Position prices (end of period) — applies the allocation you ended the period with, projected back to the start
- Position prices (today) — uses your current allocation
For example, looking at 2025 with the start-of-period option shows what your 2025 return would have been if you'd done nothing all year and just held what you owned on January 1st.
Simpler date pickers
The date and date-time inputs across Capitally have been completely rebuilt. The browser's native picker is gone, replaced by a calendar popover that behaves the same on every device.
- Click a day on the calendar, or type the date directly into the field
- Arrow keys step through dates; Shift + arrow jumps by 10
- Formatting follows your language and locale
- As everything in Capitally - optimized for Mobile
You'll see it everywhere dates are entered — transaction forms, report periods, data source ranges, and so on.