You've done the hard work. You researched strategies, picked the stocks and ETFs that fit your goals, built a diversified portfolio — maybe across several brokers to keep fees down. The hard question comes after the buying stops: is the plan actually working? Are you beating inflation once fees, taxes, and currency moves are taken out? When you overweighted technology, did it pay off, or did it just add risk?
A brokerage statement won't answer those questions. A portfolio analysis tool will — if it's the right one. I'm Rafał, and I built Capitally because I couldn't find a portfolio analyzer that gave me the control and the visible math I wanted for my own investments. Full disclosure: that makes me biased, so I'll be specific about where Capitally is not the right answer, and honest about what the other tools genuinely do well.
This is a real comparison of four tools I know closely — Capitally, GetQuin, Sharesight, and Snowball Analytics — judged the way an investor judges them: how accurately they track stock performance, how deep they let you analyze, what they do with your data, and how much of your real portfolio they can actually hold.
What's inside
- Which portfolio analysis tool should you choose?
- Capitally: built for investors who want control and privacy
- GetQuin: a wealth platform with a community at its core
- Sharesight: tax reporting strength, with structural constraints
- Snowball Analytics: rebalancing and goals for the FIRE investor
- The bottom line
- Common questions about portfolio analysis tools
Which portfolio analysis tool should you choose?
For a privacy-conscious investor with a complex, multi-currency portfolio who wants professional-grade return analysis, Capitally is the most capable of the four — it's the only one with on-device end-to-end encryption, and the only one that natively tracks options (with Greeks), private equity, and liabilities alongside stocks. The other three each win a narrower brief. Here's the short version before the deep dives:
- Capitally — best for analytical depth and privacy. The right fit if you hold multiple currencies and asset classes, want FX attribution and six cost-basis methods, and would rather upload a broker statement than hand a password to an aggregator. Not the right fit if you want one-click bank sync and don't want a learning curve.
- GetQuin — best for casual, community-driven tracking. The right fit if you want real-time prices, a social feed, and a polished free mobile app. Not the right fit if you need CSV import, tax reporting, or strong data-privacy guarantees.
- Sharesight — best for tax reporting in supported countries. The right fit if your portfolio is mostly listed securities and you file taxes in Australia, New Zealand, Canada, the UK, or the US. Not the right fit if you hold alternative assets, liabilities, or want to switch a portfolio's base currency.
- Snowball Analytics — best for rebalancing and FIRE goal tracking. The right fit if you want target allocations, rebalancing suggestions, and a passive-income goal tracker with automatic sync. Not the right fit if you need cost-basis tax accounting, FX attribution, or native bonds, options, and liabilities.
If you want the longer methodology piece behind this, see our guide to the best portfolio tracker for the modern DIY investor.
Capitally: built for investors who want control and privacy
Capitally is a privacy-first portfolio analyzer for advanced DIY investors and high-net-worth individuals, built around on-device end-to-end encryption and the ability to track almost any asset class. It trades automatic broker sync for a more hands-on workflow — you upload statements yourself — in exchange for more accurate data and full control. Founded in 2023, it has shipped quickly: a deep analytics interface, first-class options and private-equity tracking, and capital-gains tax handling for 11 jurisdictions.
What makes Capitally different for tracking stock performance
The cornerstone is privacy through end-to-end encryption. Your financial data is encrypted on your device with a key derived from your password that never leaves it — even Capitally can't read your data, and all calculations run on-device. Servers are hosted in Europe (GDPR by design), there are no ads and no third-party trackers, and you can export everything at any time. For anyone who treats financial privacy as non-negotiable, this is rare among portfolio trackers.
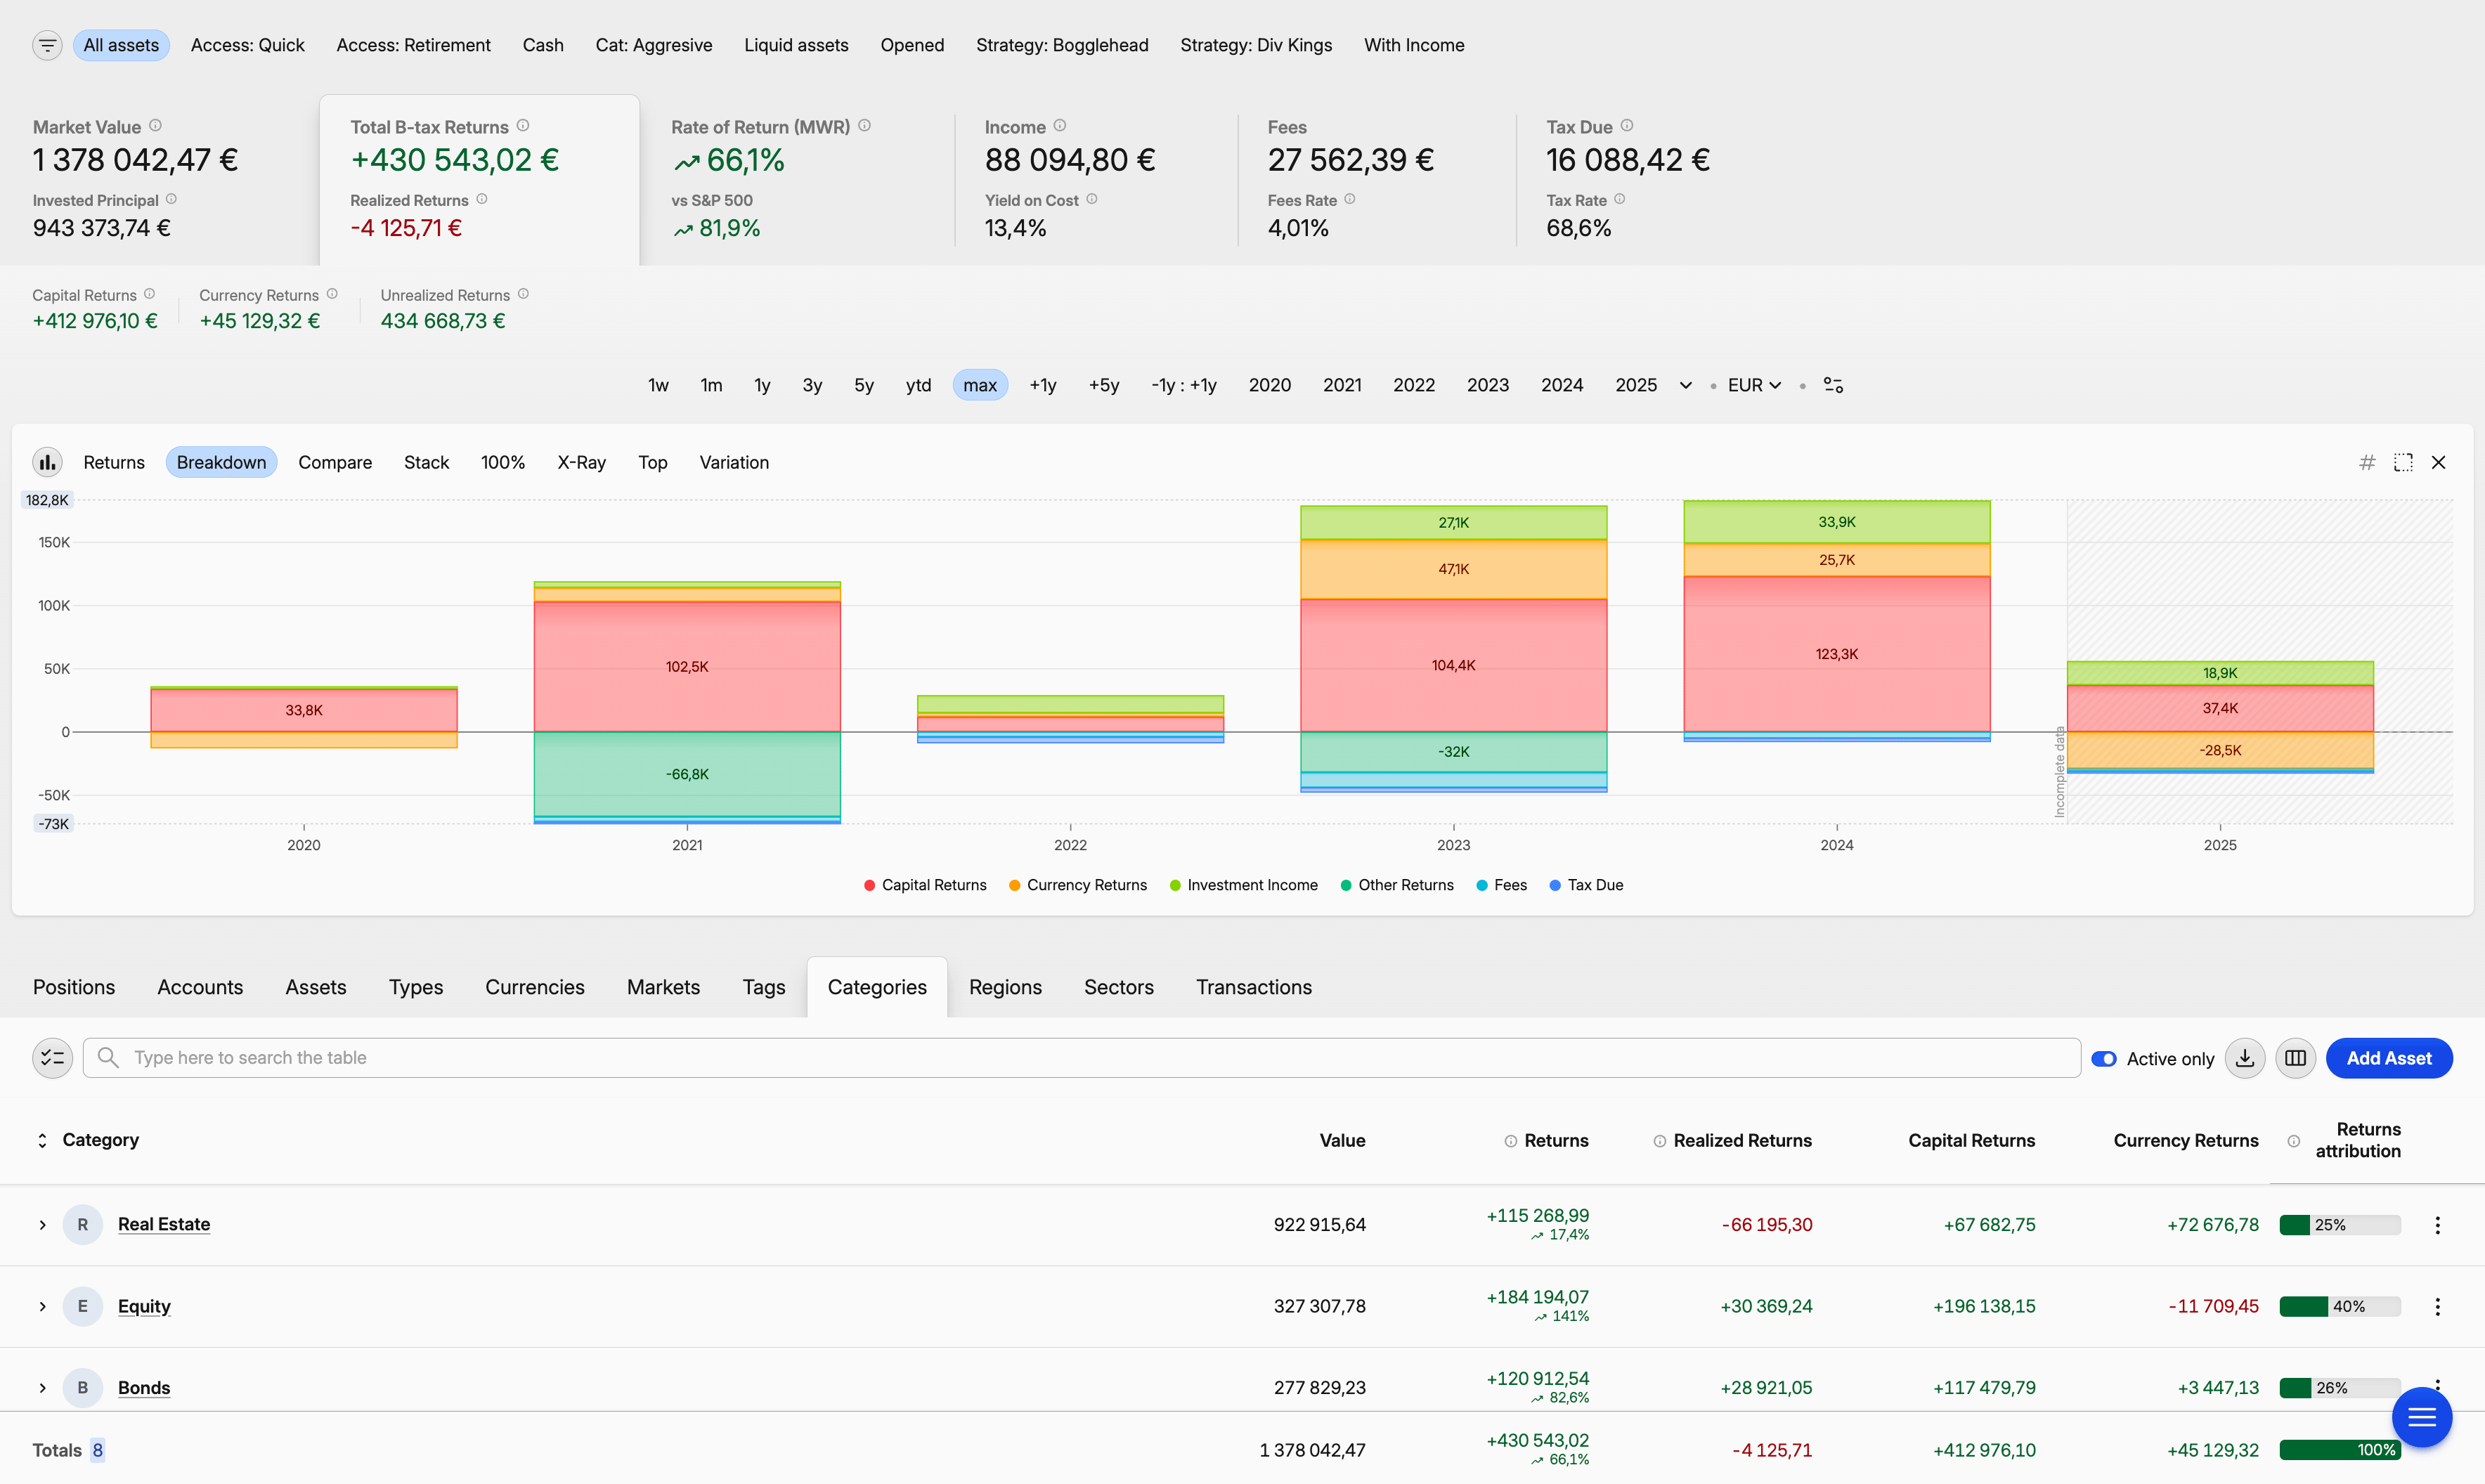
The portfolio analyzer itself is built around a single Portfolio Explorer — think Excel's pivot tables crossed with modern charting, with deep filtering throughout. You can build any chart type (line, stacked, bars, volatility, X-Ray, heatmap, treemap), analyze any time period, group by asset, account, currency, category or region, then save your favorite views. Core metrics cover MWR, TWR, IRR, and ROI, plus period-return columns from one month to five years.
Multi-currency handling works the way global investors actually need it. Transactions, prices, fees, and reports can all mix currencies; you can switch your viewing currency at any time; and a dedicated currency-returns metric separates FX impact from capital returns — so you can see whether a "good year" came from the asset or from the exchange rate.
Where Capitally shines for portfolio optimization
Capitally's strongest areas are data import, asset breadth, and tax handling. The importer is a column-matching engine for CSV, Excel, or direct copy-paste: it shows your source data, the resulting transactions, and the no-code mapping logic side by side, supports formulas and on-the-fly price fetching, and lets you save reusable presets — even per-account variants. Wrong import? Undo it in one click and re-run.
Every asset type gets first-class treatment, not an afterthought. Stocks and ETFs, bonds, real estate with rental income, P2P loans, art and collectibles, private equity (a dedicated asset type with full LP lifecycle), stock options (puts and calls, long or short, priced with Black-Scholes-Merton and Barone-Adesi-Whaley models, with Greeks), and managed "black-box" holdings. Liabilities are first-class too — dedicated Loan and Mortgage types with automatic interest accrual and amortization, plus Owed, Owned, and Debt Ratio metrics and a margin-requirement line for shorts.
Tax handling is built in, not bolted on. Capitally ships capital-gains presets for the US, UK, Netherlands, Poland, Czech Republic, Australia, Belgium, Canada, Germany, France, and Sweden, each with the right holding-period rules and default cost-basis method. You can pick from six cost-basis methods — FIFO, LIFO, Highest Cost, Lowest Cost, Average Cost, or manual lot selection — at the asset, account, or position level, write your own tax logic in a preset editor, and use the tax-loss harvesting tool's harvestable-quantity column to see exactly how many shares to sell for a target benefit.
Benchmarks go well beyond a single index. Compare against up to 10 benchmarks at once — indexes, ETFs, custom assets, account folders, portfolio subsets, or a Position-Prices benchmark that answers "what would my return have been if I hadn't traded at all?". A built-in library of economic indicators (CPI, house-price indices, policy rates) for 60+ countries can be used as benchmarks, and a discount-by option subtracts any of them to show real returns net of inflation.
Where Capitally falls short
Capitally's main limitation is the flip side of its privacy stance: there's no automatic broker linking. You upload statements manually instead. That's a deliberate trade-off — and it's also why the data ends up more accurate, since a broker's own statement usually goes back to account opening and keeps every corporate action, DRIP run, and FX conversion intact, where aggregators often surface only recent balances. But it is more hands-on than set-and-forget alternatives.
It's also not a stock-research tool — there are no stock fundamentals and no technical chart indicators, because Capitally focuses purely on portfolio performance, not stock selection. Dedicated strategy backtesting and a rebalancing engine are on the roadmap but not built yet, though you can model scenarios in a separate "what-if" project and use the Position-Prices benchmark as a no-trading baseline. There are no watchlists or price alerts. And the interface's flexibility means a real learning curve — with this many options, new users can feel overwhelmed at first.
Capitally pricing and verdict
Capitally has three plans: Sailor at €80/year (1 project, up to 50 assets), Navigator at €130/year (5 projects, unlimited assets, multiple benchmarks, discounted returns), and Captain at €250/year (unlimited projects, private-equity tracking, options and margin, all advanced features). There's a 14-day trial with no credit card, and subscribers lock in their price for the life of the subscription.
For investors managing diversified, international portfolios who value data privacy and analytical depth — and who don't mind a hands-on workflow — Capitally is the most comprehensive of the four. It gives you headroom in what you can track now and later, at the cost of being less automatic than aggregator-based tools.
GetQuin: a wealth platform with a community at its core
GetQuin is a community-driven wealth platform best suited to casual investors who want real-time prices and a social feed. Founded in Berlin in 2020 with 500k+ users, it began as a social-investing app and, since 2025, has repositioned as a broader "wealth platform" — adding AI portfolio analysis, financial planning, retirement planning, and a separate paid AI Advisory tier on top of the original community layer.
What GetQuin does well as a portfolio tracker
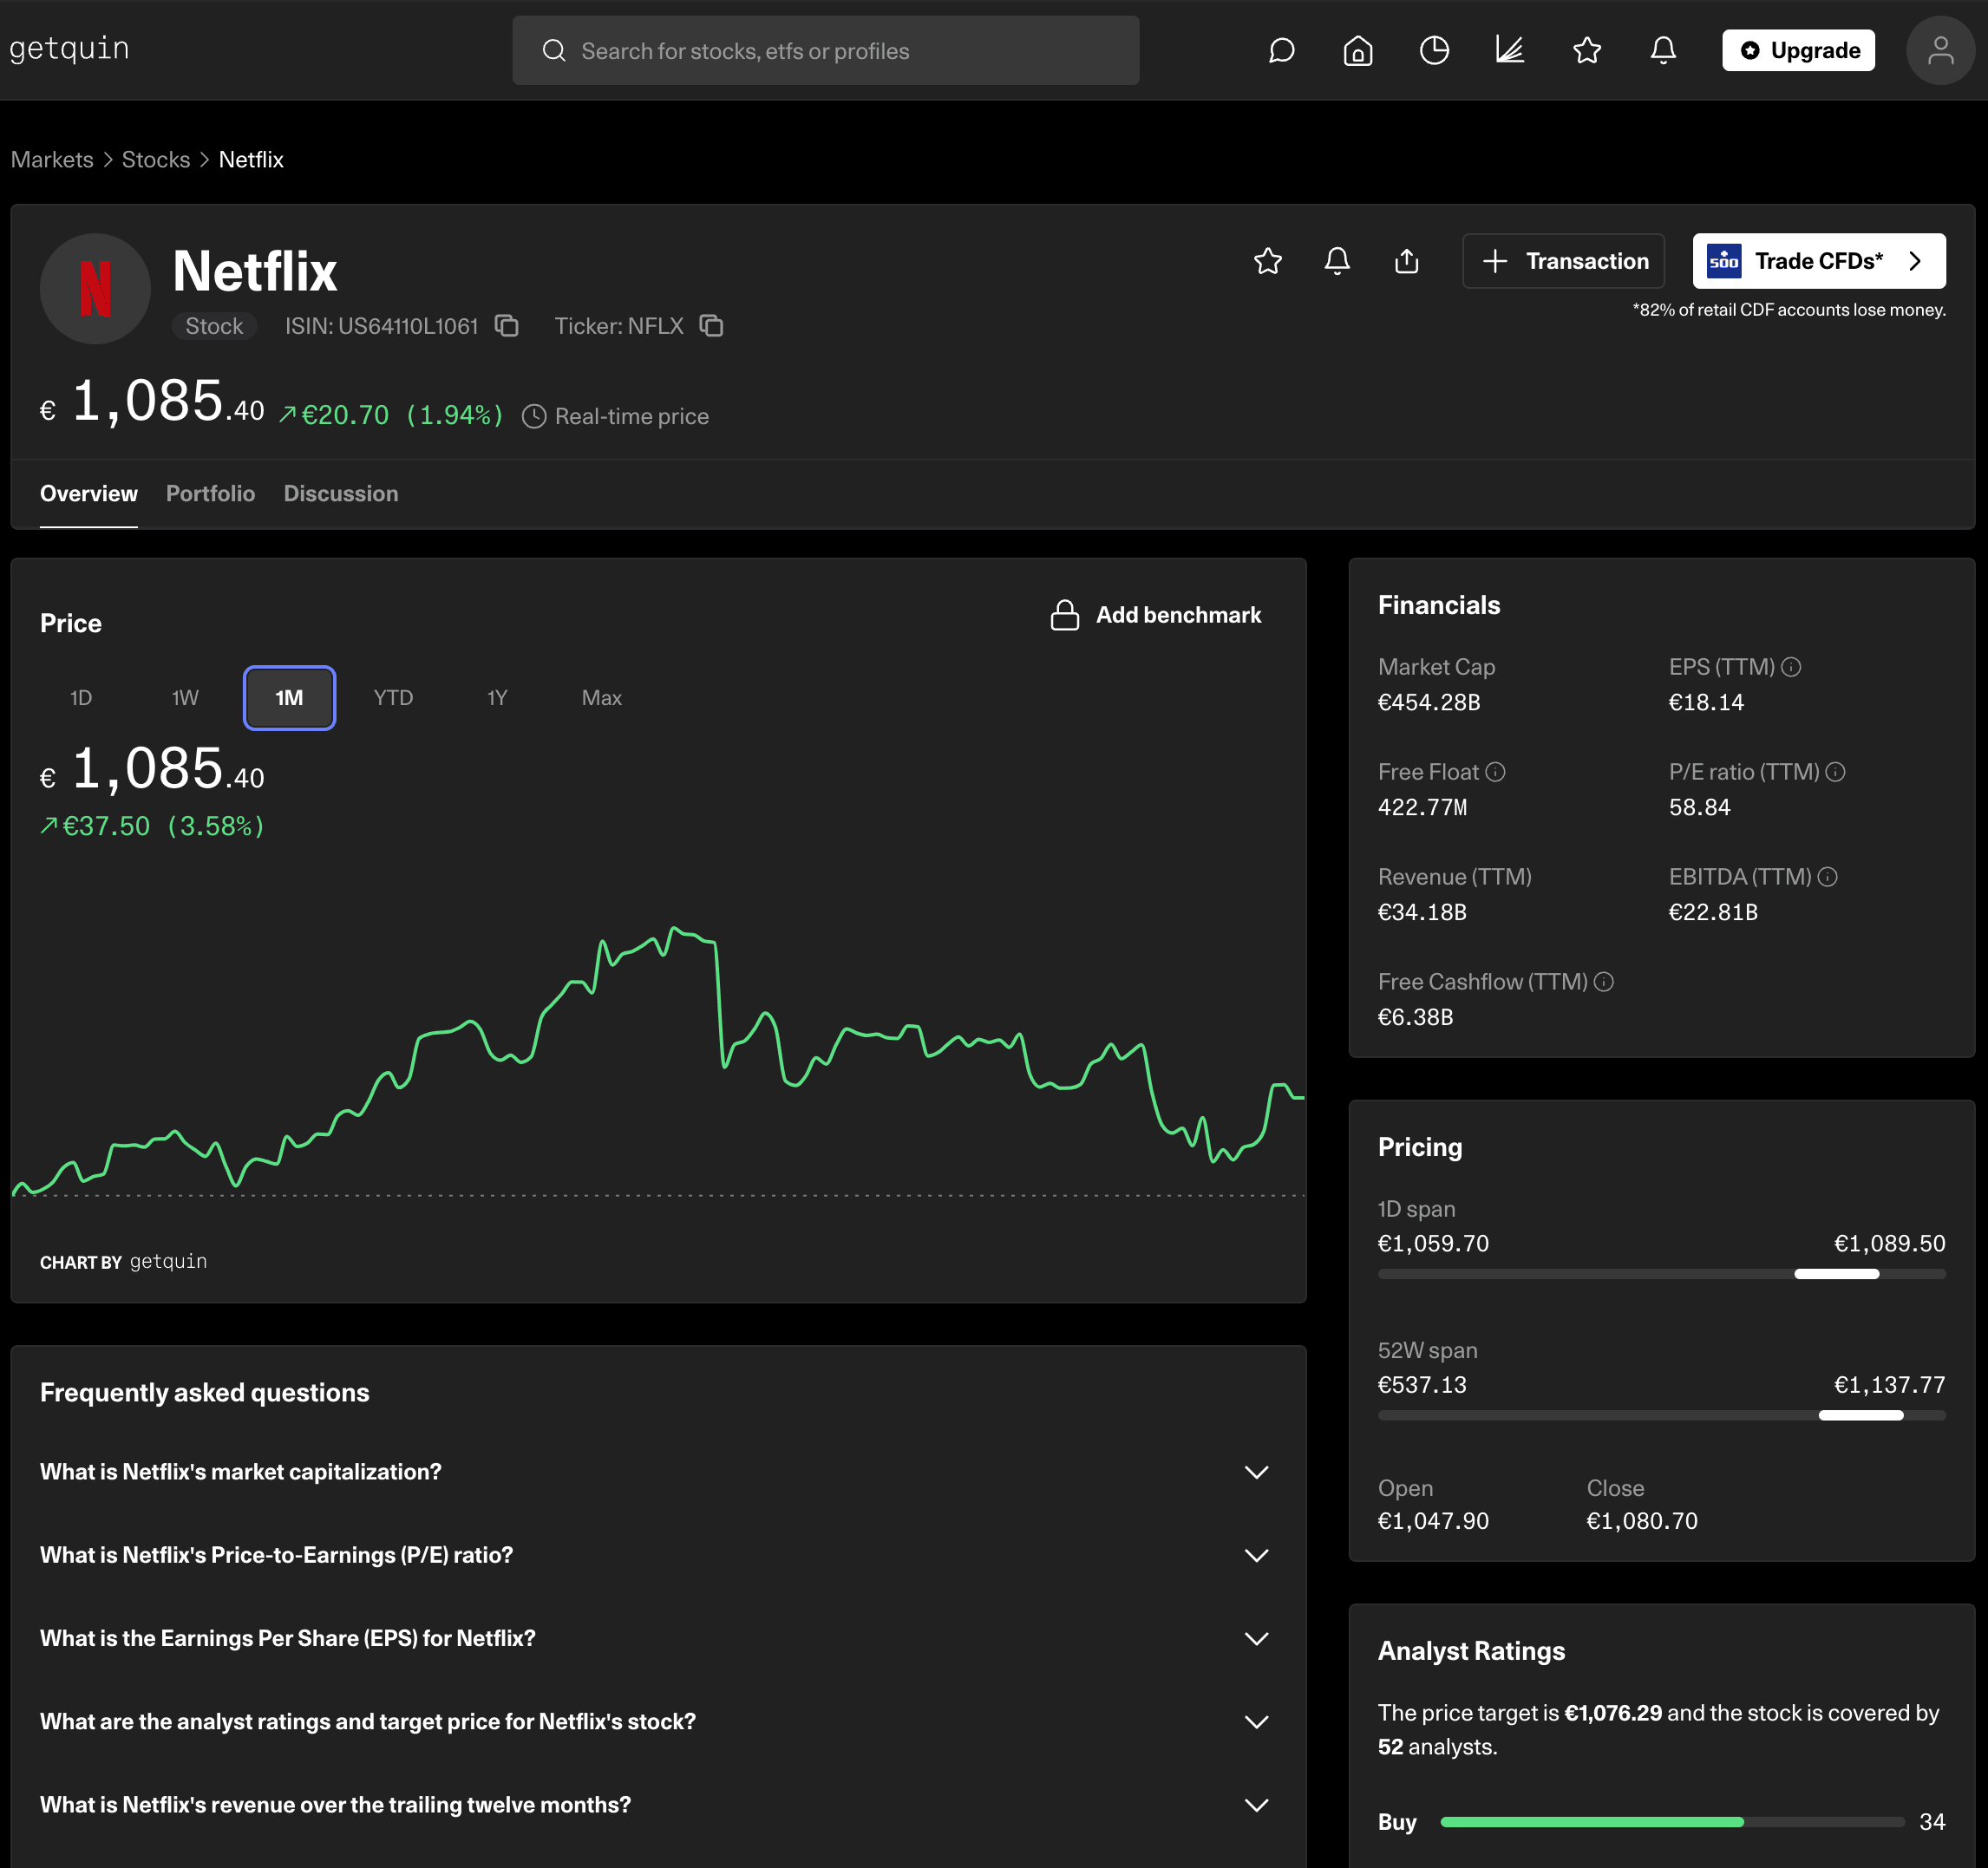
GetQuin's standout strengths are real-time data and its social layer. It offers real-time price updates for stocks, ETFs, funds, cryptocurrencies, and bonds on both free and premium plans — making it a capable stock tracker, since the other three tools in this comparison are end-of-day or delayed. The community is a genuine way to find new ideas, and built-in stock fundamentals and screeners support that. Native iOS and Android apps cover the same ground as the web, and the AI-powered diversification analysis added in 2025 breaks exposure down across countries, sectors, currencies, and asset classes.
Critical limitations for serious portfolio analysis
GetQuin's data handling is where it falls down for serious analysis. The most striking gap: there's no usable CSV import. The marketing site lists CSV upload, but in practice the only in-app options are aggregator sync or entering every transaction one by one. Where Capitally lets you map a broker's CSV or statement with a saved preset, GetQuin effectively forces aggregator sync or manual entry.
Broker connections run through third-party aggregators, which means often sharing broker credentials and 2FA codes with a third party — and there are documented user reports of suspicious broker-login activity after enabling sync. Major brokers like Interactive Brokers sync balances only, not transaction history. There's no tax support of any kind — no capital-gains calculation, no tax reports — where Capitally ships presets for 11 jurisdictions. Custom assets are basic: you set a current value, but there's no history import and they don't feed the diversification charts.
On privacy, GetQuin uses standard practices — HTTPS and encryption at rest — but data lives on its servers, it's not end-to-end encrypted, there's no two-factor authentication, and there's no simple way to export your own data. For a privacy-conscious investor, that's a meaningful gap next to Capitally's on-device encryption.
Verdict on GetQuin as a portfolio analyzer
GetQuin offers a capable ad-supported free tier, a Premium plan at roughly €49.99/year (adding true time-weighted return and benchmarking), and a separate paid AI Advisory tier. It works well for casual investors who value community and real-time prices over deep analysis or data control. For serious portfolio optimization — custom imports, tax accounting, alternative assets, privacy — you'll spend more time working around its limits than gaining insight.
Sharesight: tax reporting strength, with structural constraints
Sharesight is the strongest pick for tax reporting if you invest in listed securities and file in Australia, New Zealand, Canada, the UK, or the US. Founded in 2007, it has built a focused niche around automatic dividend tracking and country-specific tax reports, passed SOC 2 Type 2 certification in 2025, and through 2025–2026 expanded coverage into bonds, precious metals, and new analytics. It's best for English-speaking, single-currency investors holding mostly publicly traded assets.
Where Sharesight excels as an investments tracker
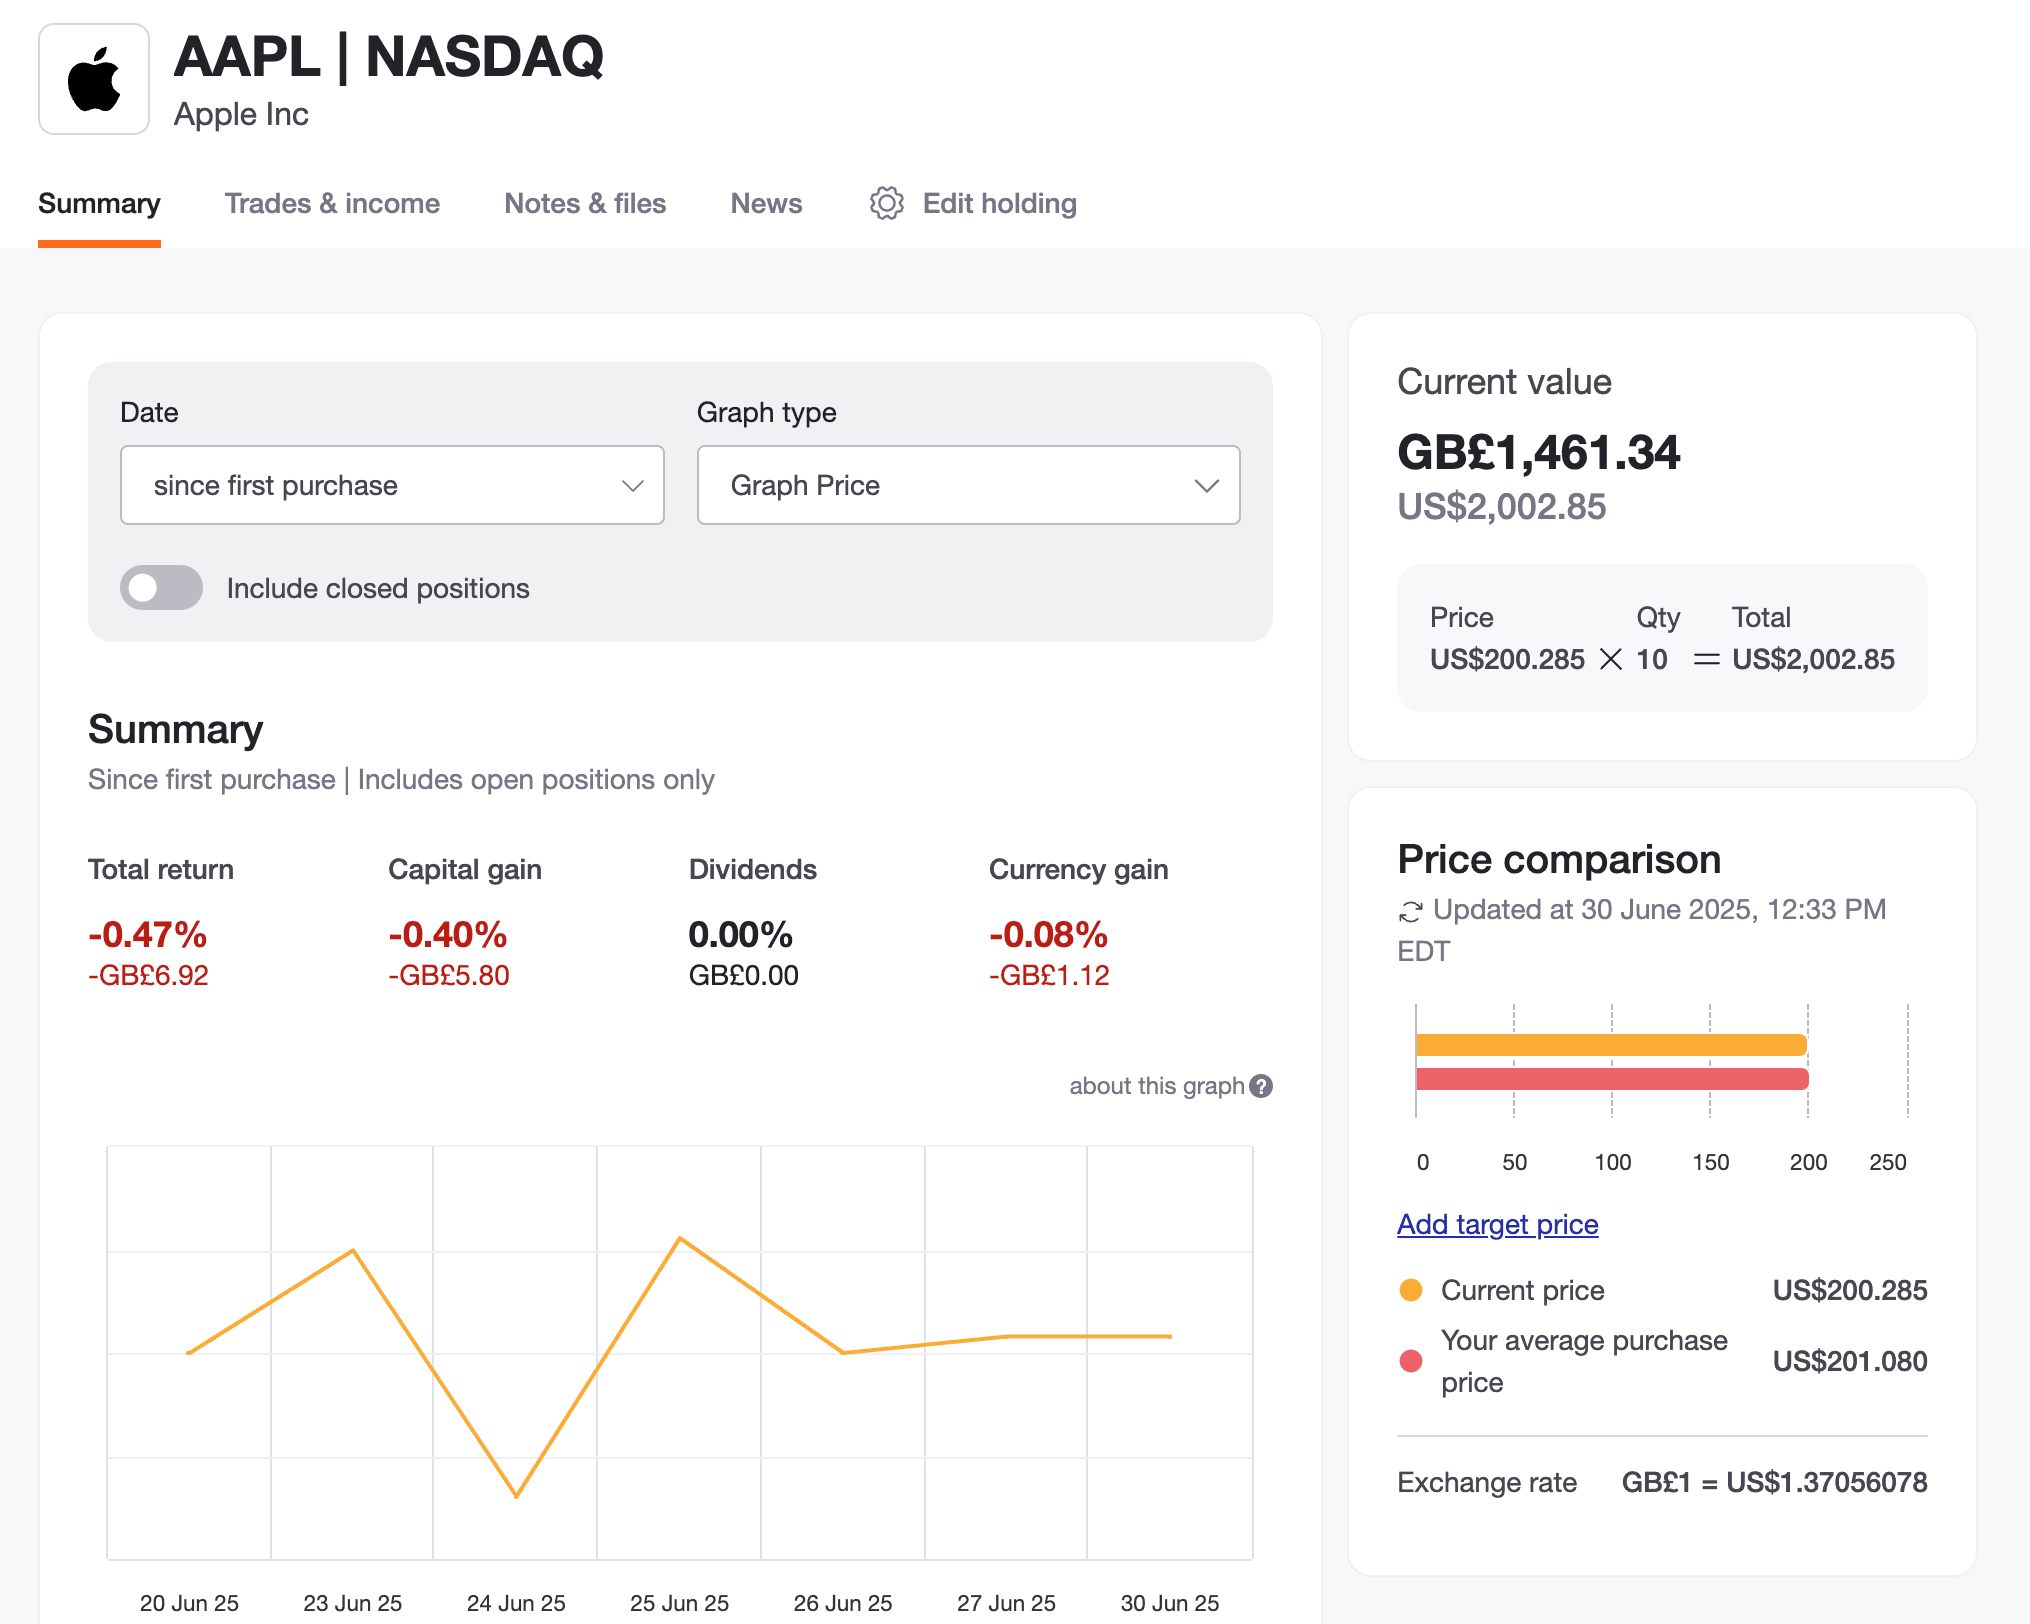
Sharesight's clear strength is tax and dividends for listed securities. For investors in its five supported countries, it produces tailored capital-gains and taxable-income reports — with FIFO, LIFO, and Minimise Gain methods — that genuinely save hours at filing time. It automatically tracks announced dividends, processes splits and corporate actions, and handles DRIPs by creating the matching buy transactions. The 2025 Future Income report forecasts dividends up to three years out, and the Exposure Report looks through ETFs to show your true underlying holdings — so if you hold both SPY and QQQ, you see your real Apple exposure.
Significant drawbacks for portfolio performance tracking
Sharesight's constraints are structural. Each portfolio locks to one base currency, tied to a tax jurisdiction set at creation, and can't be changed afterward — so an investor managing USD, EUR, and PLN can't simply re-base a portfolio. It does separate capital and currency gains, but the rigidity hurts. There's no support for liabilities — loans, mortgages, margin, and short positions are out of scope — and custom assets like real estate, private equity, or art are entirely manual, without class-specific functionality.
The import workflow is functional but dated: CSV with templates, a column-mapping and review step — but no way to save mappings, so you re-map on every upload, and wrong imports can't be quickly undone. This is exactly where Capitally's reusable, per-account import presets pull ahead. The interface, historically its weakest point, is being rebuilt — the new Investments tab arrived in early 2026 — but it can still lag on large portfolios, and most insights live inside reports you have to configure before seeing anything. Market data is delayed (15–20 minutes, end-of-day on basic plans). On privacy, data isn't end-to-end encrypted, there's no full one-click export, and an audit in May 2026 found in-app marketing trackers (Meta Pixel, LinkedIn, Reddit, Taboola, Bing UET).
Sharesight pricing and final thoughts
Sharesight runs five tiers: Free (1 portfolio, 10 holdings), Starter at $7/month (30 holdings), Standard at $18/month (4 portfolios, unlimited holdings, plus Future Income, Contribution Analysis, Multi-Currency Valuation, and Drawdown Risk reports), Premium at $23.25/month (10 portfolios, Multi-Period reporting), and a Business plan for advisors. Meaningful features start at Standard, and annual billing knocks off about 25%; free users get a shared demo portfolio to evaluate the advanced reports.
Sharesight works best for tax-conscious investors in its supported countries who primarily hold publicly traded securities. The tax reporting is genuinely valuable — but the single-currency-per-portfolio rule, the lack of liabilities and real custom-asset support, and the report-driven interface limit it for dynamic, multi-asset portfolio analysis.
Snowball Analytics: rebalancing and goals for the FIRE investor
Snowball Analytics is a good fit for FIRE and passive-income investors who want target allocations, rebalancing suggestions, and goal tracking with automatic broker sync. Launched in 2022 and based in Lyon, it stands out among trackers for actually helping you act on your portfolio — not just observe it — though it makes real compromises on tax accounting, multi-currency analysis, and asset coverage.
Snowball's strengths as a portfolio performance tracker
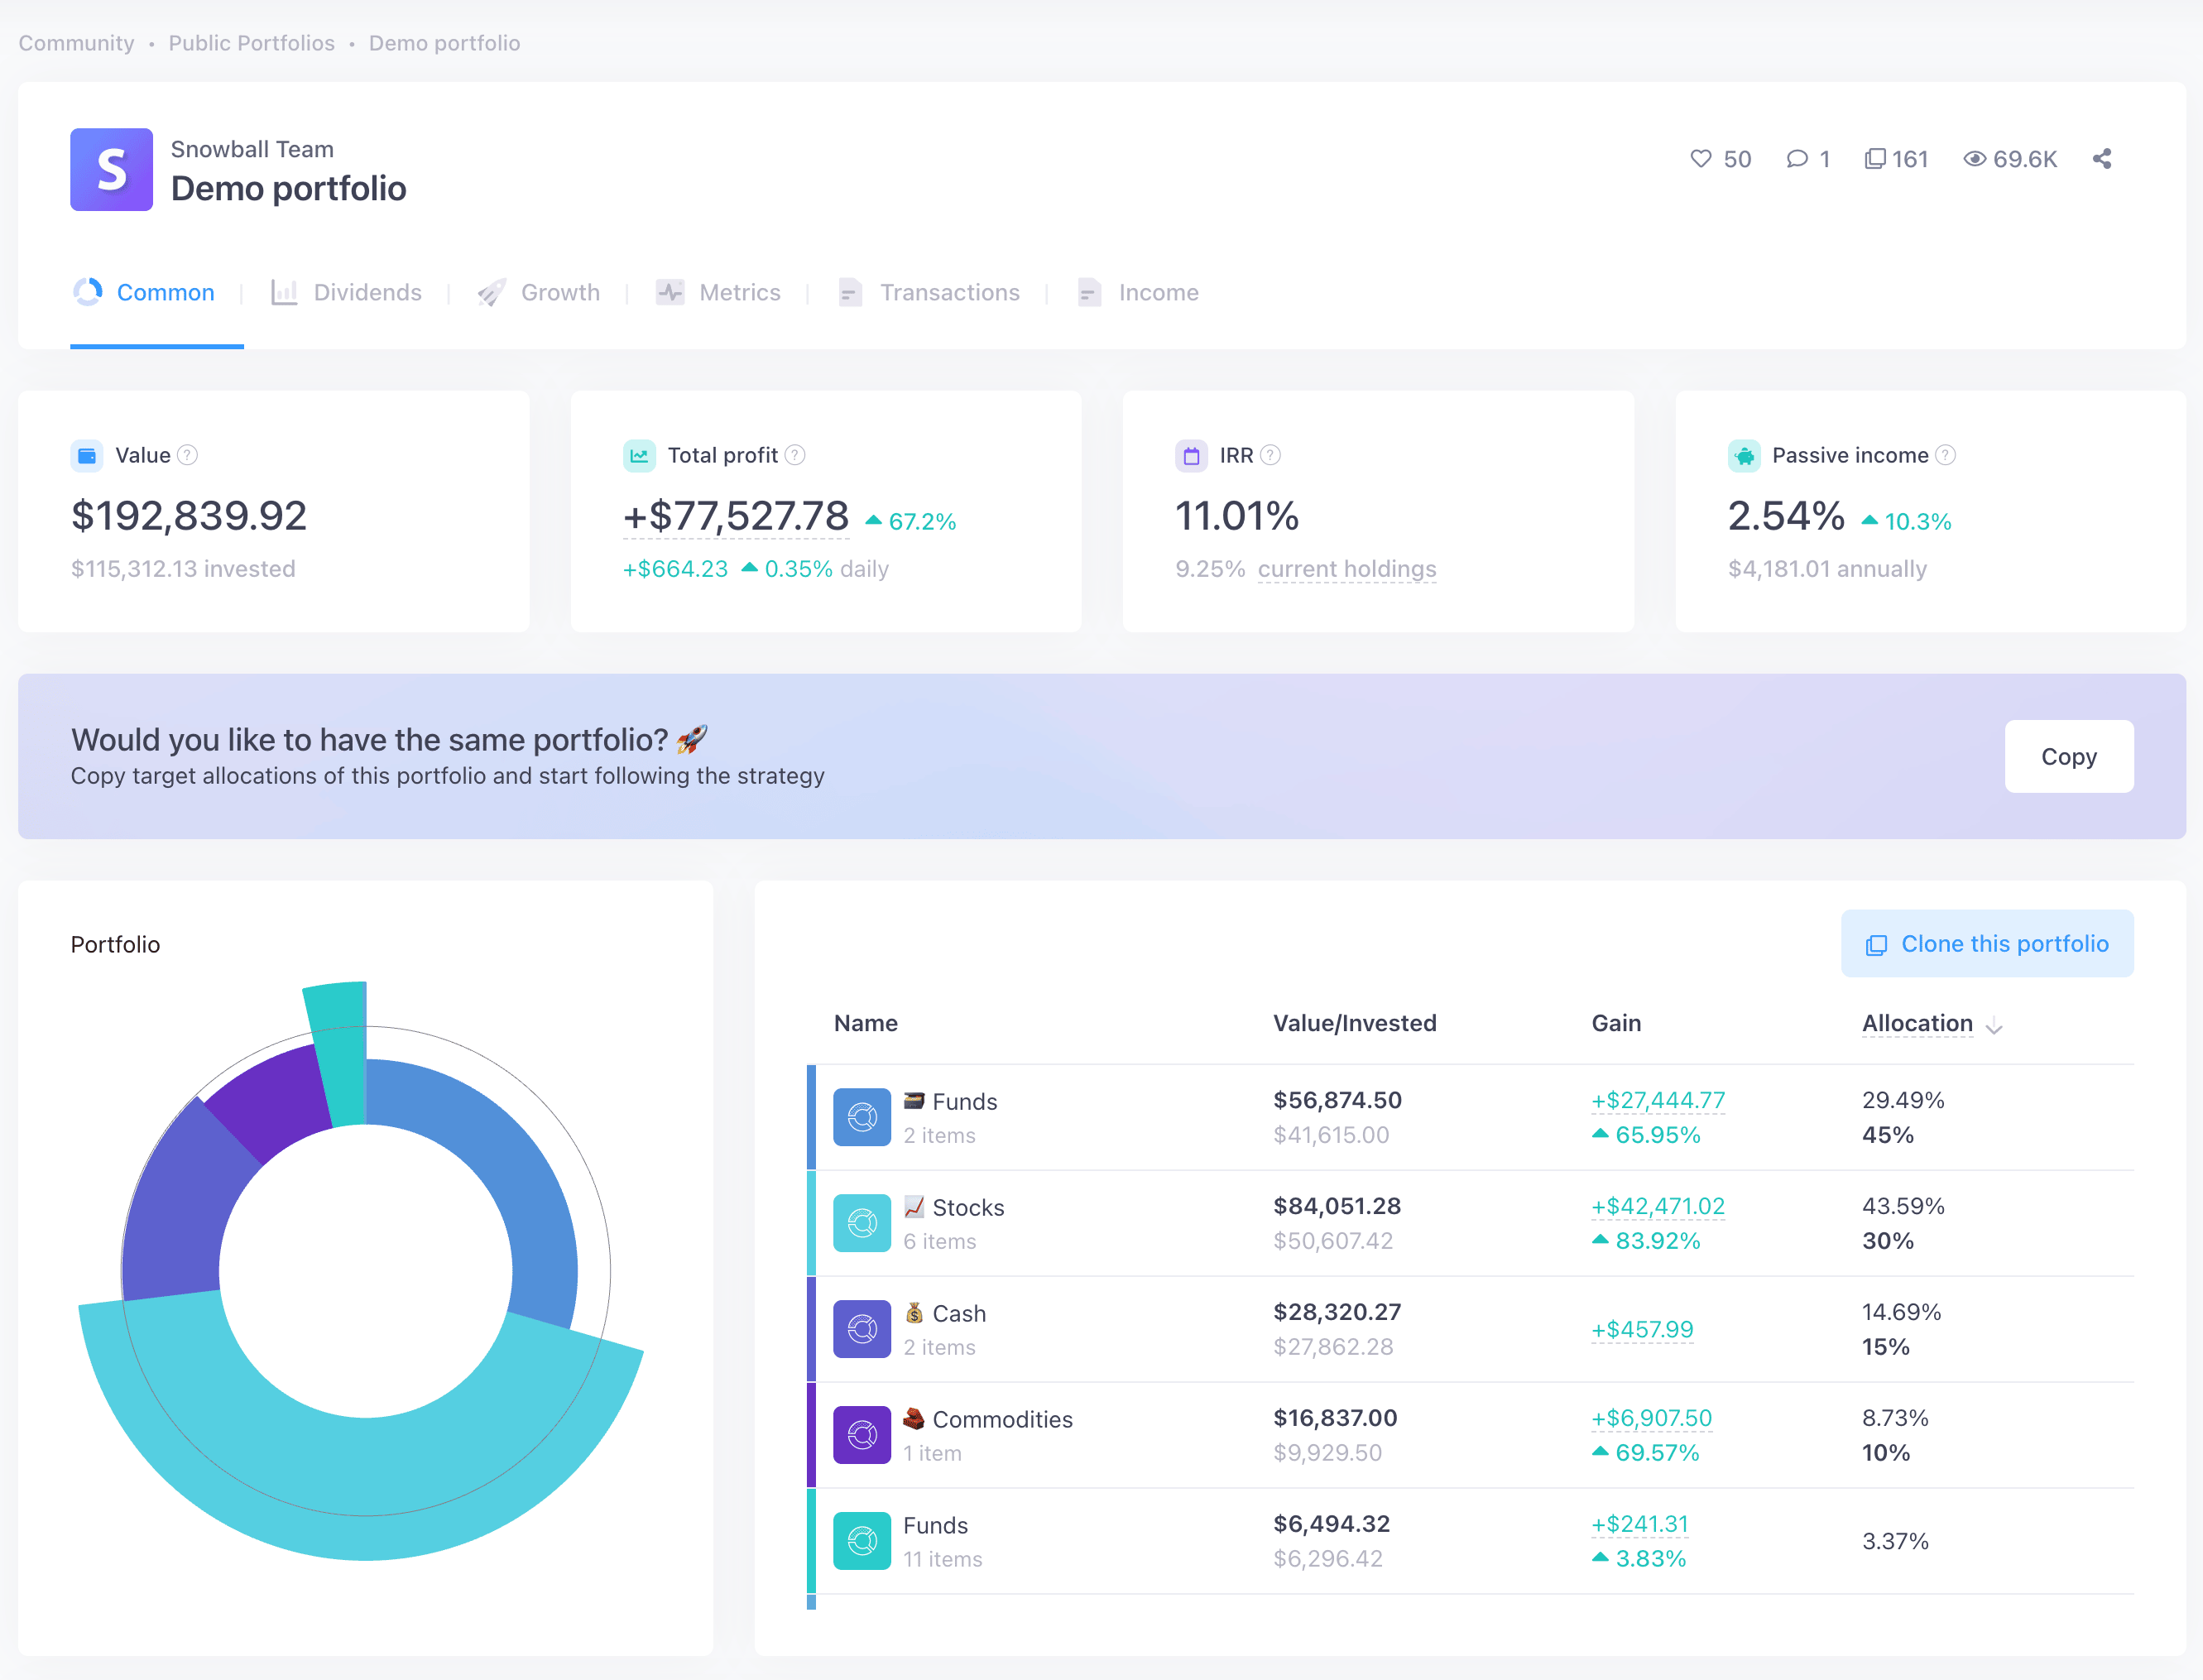
Snowball's genuine differentiator is portfolio optimization. Where most trackers only report, Snowball lets you set category-based target allocations, get rebalancing suggestions that propose specific buy and sell trades, backtest asset allocations, and define a single goal — portfolio value or passive income — with a probability of achievement. Performance reporting is solid: money-weighted and time-weighted returns (TWR left beta in 2025), Sharpe ratios, and risk-adjusted metrics. A proprietary Dividend Rating, a 12-month payout forecast, and an X-Ray fund look-through round out a clean, dashboard-focused experience.
Limitations of Snowball as a portfolio analyzer
Snowball's data import and tax handling are its weak points. Custom imports need pre-formatted files with specific required columns — there's no column-mapping interface, so you prepare data outside the platform before uploading, where Capitally maps it for you. Automatic sync runs through Yodlee and SnapTrade, with a native Interactive Brokers integration added in early 2026, but aggregator sync still means sharing credentials, and imported detail varies.
On tax, Snowball has no cost-basis methods at all — no FIFO, no Average Cost, no specific-lot selection — and no tax reports; you can only log withholding tax on dividends. Multi-currency support converts to a base currency but offers no FX-versus-capital return attribution, so global investors lose part of the picture — a gap Capitally closes directly. Coverage has holes too: bonds and stock options aren't natively supported (they land as untyped custom holdings), there's no support for liabilities, real estate isn't a native type, and custom assets lack class-specific functionality like rental income or loan installments. A May 2026 audit also found several in-app advertising trackers.
Snowball pricing and verdict
Snowball Analytics runs Free, Starter at $7.99/month, Investor at $14.99/month, and Expert at $24.99/month, each with a 14-day trial. For European FIRE and passive-income investors focused on long-term wealth building, the rebalancing and goal tools offer real value. But the missing cost-basis tax accounting, the lack of FX attribution, and the gaps in native asset coverage make it a poorer fit for complex, multi-currency, or alternative-asset portfolios.
The bottom line
A good portfolio analysis tool should help you answer the real questions about your investments — your return after fees, taxes, and currency, and whether your strategy is on track — without compromising your data or capping your analysis. Sharesight wins on country-specific tax reporting, Snowball on rebalancing and goals, GetQuin on real-time prices and community. For analytical depth, asset breadth, and privacy in a single tool, Capitally is built to lead.
Remember
The goal isn't just to track what you own, but to understand whether your investment strategy is working and how to improve it. Choose the tool that best helps you achieve that understanding.
Common questions about portfolio analysis tools
Snowball Analytics is a solid choice for FIRE and passive-income investors who want rebalancing suggestions, allocation backtesting, and goal tracking with automatic broker sync. Its main gaps are tax — it has no cost-basis methods like FIFO or Average Cost and no tax reports — and no FX-versus-capital return attribution, so multi-currency investors lose part of the picture. It also can't natively track bonds, options, or liabilities.
For listed-security investors who file in Australia, New Zealand, Canada, the UK, or the US, Sharesight has the most polished country-specific tax reports. For a wider set of jurisdictions and asset types, Capitally has built-in capital-gains presets for 11 countries, six cost-basis methods selectable per position, and a tax-loss harvesting tool. GetQuin and Snowball Analytics have no tax reporting at all.
Capitally never connects to your bank or broker through an aggregator — you upload broker statements manually, and your data is end-to-end encrypted on your device. GetQuin, Sharesight, and Snowball Analytics all rely on third-party aggregators like Plaid, Yodlee, or SnapTrade for automatic sync, which means sharing broker credentials with a third party; Sharesight and Snowball also accept manual CSV imports.
Choose Snowball Analytics if your priority is rebalancing suggestions, allocation backtesting, and a passive-income goal tracker with automatic broker sync. Choose Capitally if you need cost-basis tax accounting (FIFO, Average Cost, specific-lot), FX-versus-capital return attribution, native bonds, options, real estate, or liabilities — or if on-device end-to-end encryption matters more than aggregator-driven automation.
GetQuin uses standard security practices — HTTPS and encryption at rest — but it is not end-to-end encrypted, offers no two-factor authentication, and its broker connections run through third-party aggregators, with some documented user reports of suspicious broker-login activity after enabling sync. It's a reasonable casual tracker; privacy-focused investors usually want stronger guarantees, such as on-device encryption.
GetQuin has the most capable free tier — real-time prices, broker connections, and a dividend calendar, funded by ads. Sharesight and Snowball Analytics offer free plans capped at 10 holdings, enough to test but not to run a real portfolio. Capitally has no free plan but offers a 14-day trial with no credit card required.