The best dividend tracker does more than list payments — it forecasts your future income, separates real growth from currency noise, and shows your total return so a high yield can't quietly hide a shrinking portfolio. For an international investor juggling multiple brokers, currencies, and reinvested dividends, a spreadsheet stops being enough surprisingly fast.
If you've been tracking dividend income in a spreadsheet, you know how quickly it turns from empowering to tedious. This is an honest review of five popular dividend trackers — Capitally, Sharesight, Snowball Analytics, The Dividend Tracker, and Track Your Dividends — covering what each does well, where it falls short, and who it actually fits. Prices and features were checked in May 2026.
Table of Contents
- What's the best dividend tracker in 2026?
- Capitally: Best for privacy-conscious investors with diverse income streams
- Sharesight: Best dividend tax reporting for Australia and New Zealand
- Snowball Analytics: Best for European investors who want strategy tools
- The Dividend Tracker: Best polished mobile app for US, UK & Canadian investors
- Track Your Dividends: Best free starting point for US & Canadian beginners
- The verdict: choosing your best dividend tracker
- Frequently asked questions
What's the best dividend tracker in 2026?
For most international and privacy-conscious investors, Capitally is the best dividend tracker in 2026 — it forecasts income across stocks, bonds, rentals, and crypto staking, separates currency moves from real returns, and keeps your data encrypted on your own device. But the right pick depends on where you invest and what you need.
- Choose Capitally if you hold diverse income streams across multiple currencies and want total-return analytics with on-device encryption — no broker passwords handed to an aggregator.
- Choose Sharesight if your portfolio is mostly listed securities and your priority is tax reporting for Australia, New Zealand, the UK, Canada, or the US.
- Choose Snowball Analytics if you want target allocations, rebalancing, and backtesting alongside dividend tracking, and you're comfortable with broker aggregation.
- Choose The Dividend Tracker if you want a polished mobile app for a dividend-only portfolio in US, UK, or Canadian markets.
- Choose Track Your Dividends if you're a US or Canadian beginner who wants a genuinely useful free tier to start tracking dividend income.
Dividend tracker comparison at a glance
All five tools track dividend income and show a payout calendar. They diverge on everything else — asset coverage, whether they show total return, how they handle currencies and tax, and how your data gets in. This table maps the differences that decide which one fits you.
Feature | Capitally | Sharesight | Snowball Analytics | The Dividend Tracker | Track Your Dividends |
|---|---|---|---|---|---|
Privacy | On-device end-to-end encryption | Standard (data on servers) | Standard (data on servers) | Standard (data on servers) | Standard (data on servers) |
Asset classes | Stocks, ETFs, bonds, options, real estate, private equity, crypto, loans, custom | Listed securities, bonds, funds; alternatives manual | Stocks, ETFs, crypto, funds; bonds/options untyped | Dividend stocks, ETFs, REITs (crypto price-only) | Dividend stocks, ETFs, REITs |
Multi-currency & FX attribution | Yes — separates currency gain from capital gain | Single base currency per portfolio; capital vs currency split | Converts to base currency; no FX attribution | Display-only conversion (USD/CAD/GBP) | USD/CAD only |
Total return (capital gains) | Yes — TWR, MWR, IRR, ROI | Yes — total return and capital gains | Yes — MWR, TWR | ❌ | ❌ |
Dividend forecasting | Multi-year estimate from 5-year growth patterns | Predictive estimates up to 3 years (paid plans) | 12-month income forecast | Future income calculators | Income projections |
DRIP handling | Dedicated DRIP and stock dividends with compounding | DRIP via auto buy transactions | Manual only | ❌ | ❌ |
Dividend safety scoring | ❌ | ❌ | Dividend Rating | Dividend Grades | 5-factor Safety Score |
Tax handling | Capital-gains presets for 11 jurisdictions, custom rules | Country tax reports: AU, NZ, CA, UK, US | ❌ (WHT only) | ❌ | ❌ |
Broker data method | Manual statement/CSV import, 70+ brokers | Email/API sync (~240 brokers) and CSV | Yodlee, SnapTrade, native IBKR | Plaid, SnapTrade, CSV | Plaid, SnapTrade (positions only), CSV |
Platforms | Web and mobile PWA (offline) | Web, iOS, Android | Web, iOS, Android | Web, iOS, Android | Web only |
Free trial | 14-day full trial, no card | Free plan (10 holdings); no full trial | Free plan and 14-day trial | Free plan (ad-supported) | Free plan |
Price | €80–€250/year | $7–$23.25/month | $7.99–$24.99/month | Free–$16.99/month | $9.99/month or $99.99/year |
What truly matters in a dividend tracker?
A great dividend tracker has to do four things well: show your real income and growth, forecast what's coming, handle reinvestment and tax correctly, and place all of it inside your total return. Here's what each of those means in practice — and what to check before you commit.
- Essential dividend metrics: A tracker must show Dividend Yield and, for long-term investors, Yield on Cost (YOC), plus a Dividend Growth Rate so you can see whether your income is outpacing inflation. Income should be viewable monthly, quarterly, and annually.
- The dividend calendar: A visual calendar shows when to expect upcoming dividends, listing ex-dividend and payout dates — ideally distinguishing officially declared payouts from estimates based on past schedules.
- Future income forecasting: Projecting income from current holdings, historical growth, and planned contributions is what turns a ledger into a planning tool for financial independence.
- Handling the snowball effect (DRIP): Dedicated support for Dividend Reinvestment Plans lets a tool forecast compounding accurately — and show what you forgo by not reinvesting. It should also handle dividends paid in stock.
- Discovery and analysis tools: Stock and dividend screeners that surface new dividend payers by yield, growth, or safety are a useful addition, though not essential if you do your own research.
- Tracking more than just dividends: True passive income also comes from bonds, P2P lending, rental income, and crypto staking. A flexible tool tracks all of it in one place.
- Tax handling: Recording withholding tax and estimating tax due matters for most investors, ideally with custom rates for dividends from different countries.
- Total portfolio performance: Dividends are only part of the story. Without capital gains and total return, a high-yield stock can lose value while you focus on the income — and you won't see the damage.
Capitally: Best for privacy-conscious investors with diverse income streams
Capitally is the best dividend tracker for investors who want privacy and a complete picture of passive income. It forecasts dividends alongside bond interest, rental income, P2P returns, and crypto staking, separates currency moves from real returns, and encrypts your data on your own device — so even Capitally can't read it. Founded in 2023, it's built for international and complex portfolios.
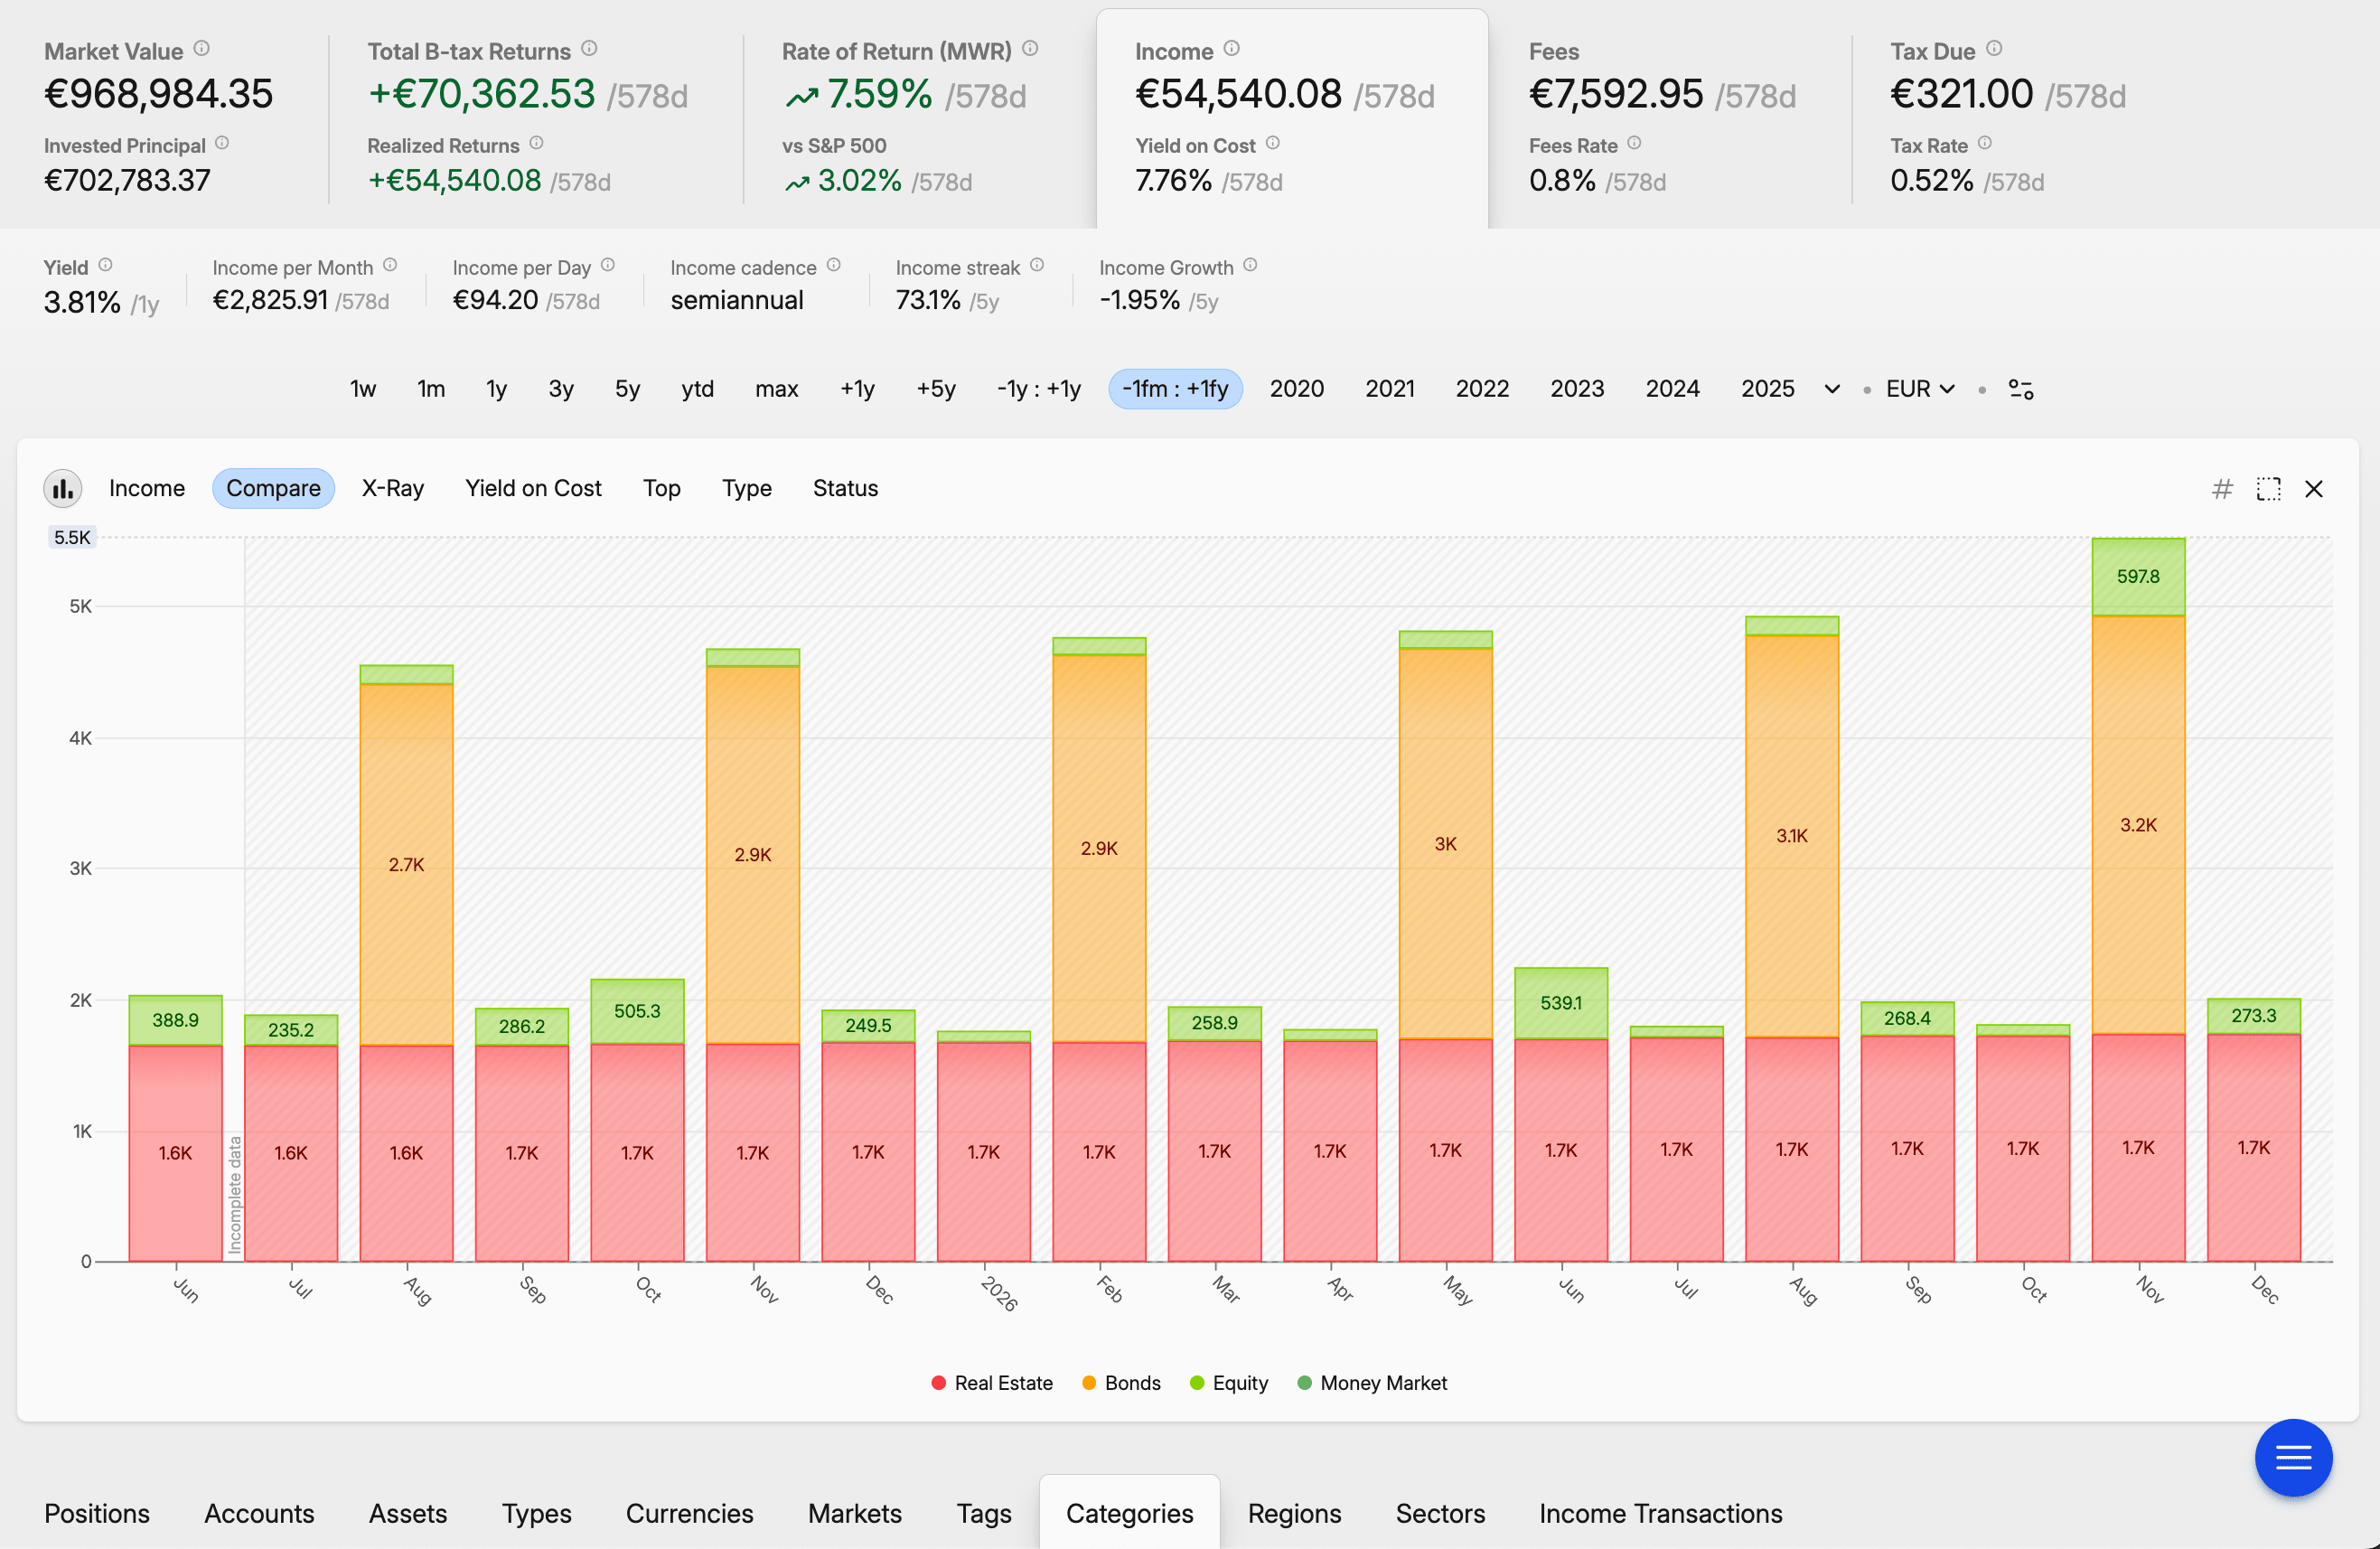 Income forecasting in Capitally
Dividend tracking capabilities
Capitally fetches dividend data automatically and supports both DRIP and dividends paid in stock with dedicated transaction types, so the snowball effect is tracked accurately. It also splits any distribution into taxable and Return-of-Capital portions, with the Return-of-Capital part adjusting cost basis automatically. The dividend calendar shows confirmed and estimated future payouts, and the income estimator projects cash flow years ahead using 5-year growth patterns. Because Capitally imports your full transaction history rather than current balances, Yield on Cost is computed against your actual purchase prices, not an average. Dividend Yield, Dividend Growth, and income cadence can be shown as a number or plotted for any period or slice of the portfolio.
Capitally's key strength is breadth: you can track interest from bonds, rental income, P2P lending returns, and crypto staking rewards right alongside stock dividends, for a true picture of total passive income. Multi-currency support is robust — view returns in any currency, and a dedicated metric separates capital gains from currency impact. For tax, Capitally records broker-reported withholding tax and includes capital-gains tax presets for 11 jurisdictions, plus a custom tax-rule editor for your own jurisdiction.
The honest tradeoff: Capitally has no stock or dividend screener. It's built for investors who do their own research and want a private, analytical tool to track and understand a portfolio — not one that suggests new investments.
Overall platform
Capitally's flexibility comes from its customization and manual import system. There's no broker password-sharing — by design. The importer maps columns from any broker's CSV or statement (70+ brokers supported out of the box) and saves the template for reuse. The CSV path is also more accurate than aggregator sync: broker exports usually go back to account opening and keep every DRIP run and corporate action intact, where aggregators tend to expose only current balances or a short transaction window. The interface is exploration-first — a portfolio explorer that works like a pivot table for your investments.
Pricing has three annual plans: Sailor at €80, Navigator at €130, and Captain at €250 (which adds private-equity tracking, options and margin, and all advanced features). A full-featured 14-day trial is available with no credit card.
Sharesight: Best dividend tax reporting for Australia and New Zealand
Sharesight is the best dividend tracker for tax reporting in Australia, New Zealand, Canada, the UK, and the US. Founded in 2007 and now past 500,000 users, it automatically tracks announced dividends and corporate actions for listed securities and generates tax reports formatted for those specific jurisdictions. It earned SOC 2 Type 2 certification in 2025.
Dividend tracking capabilities
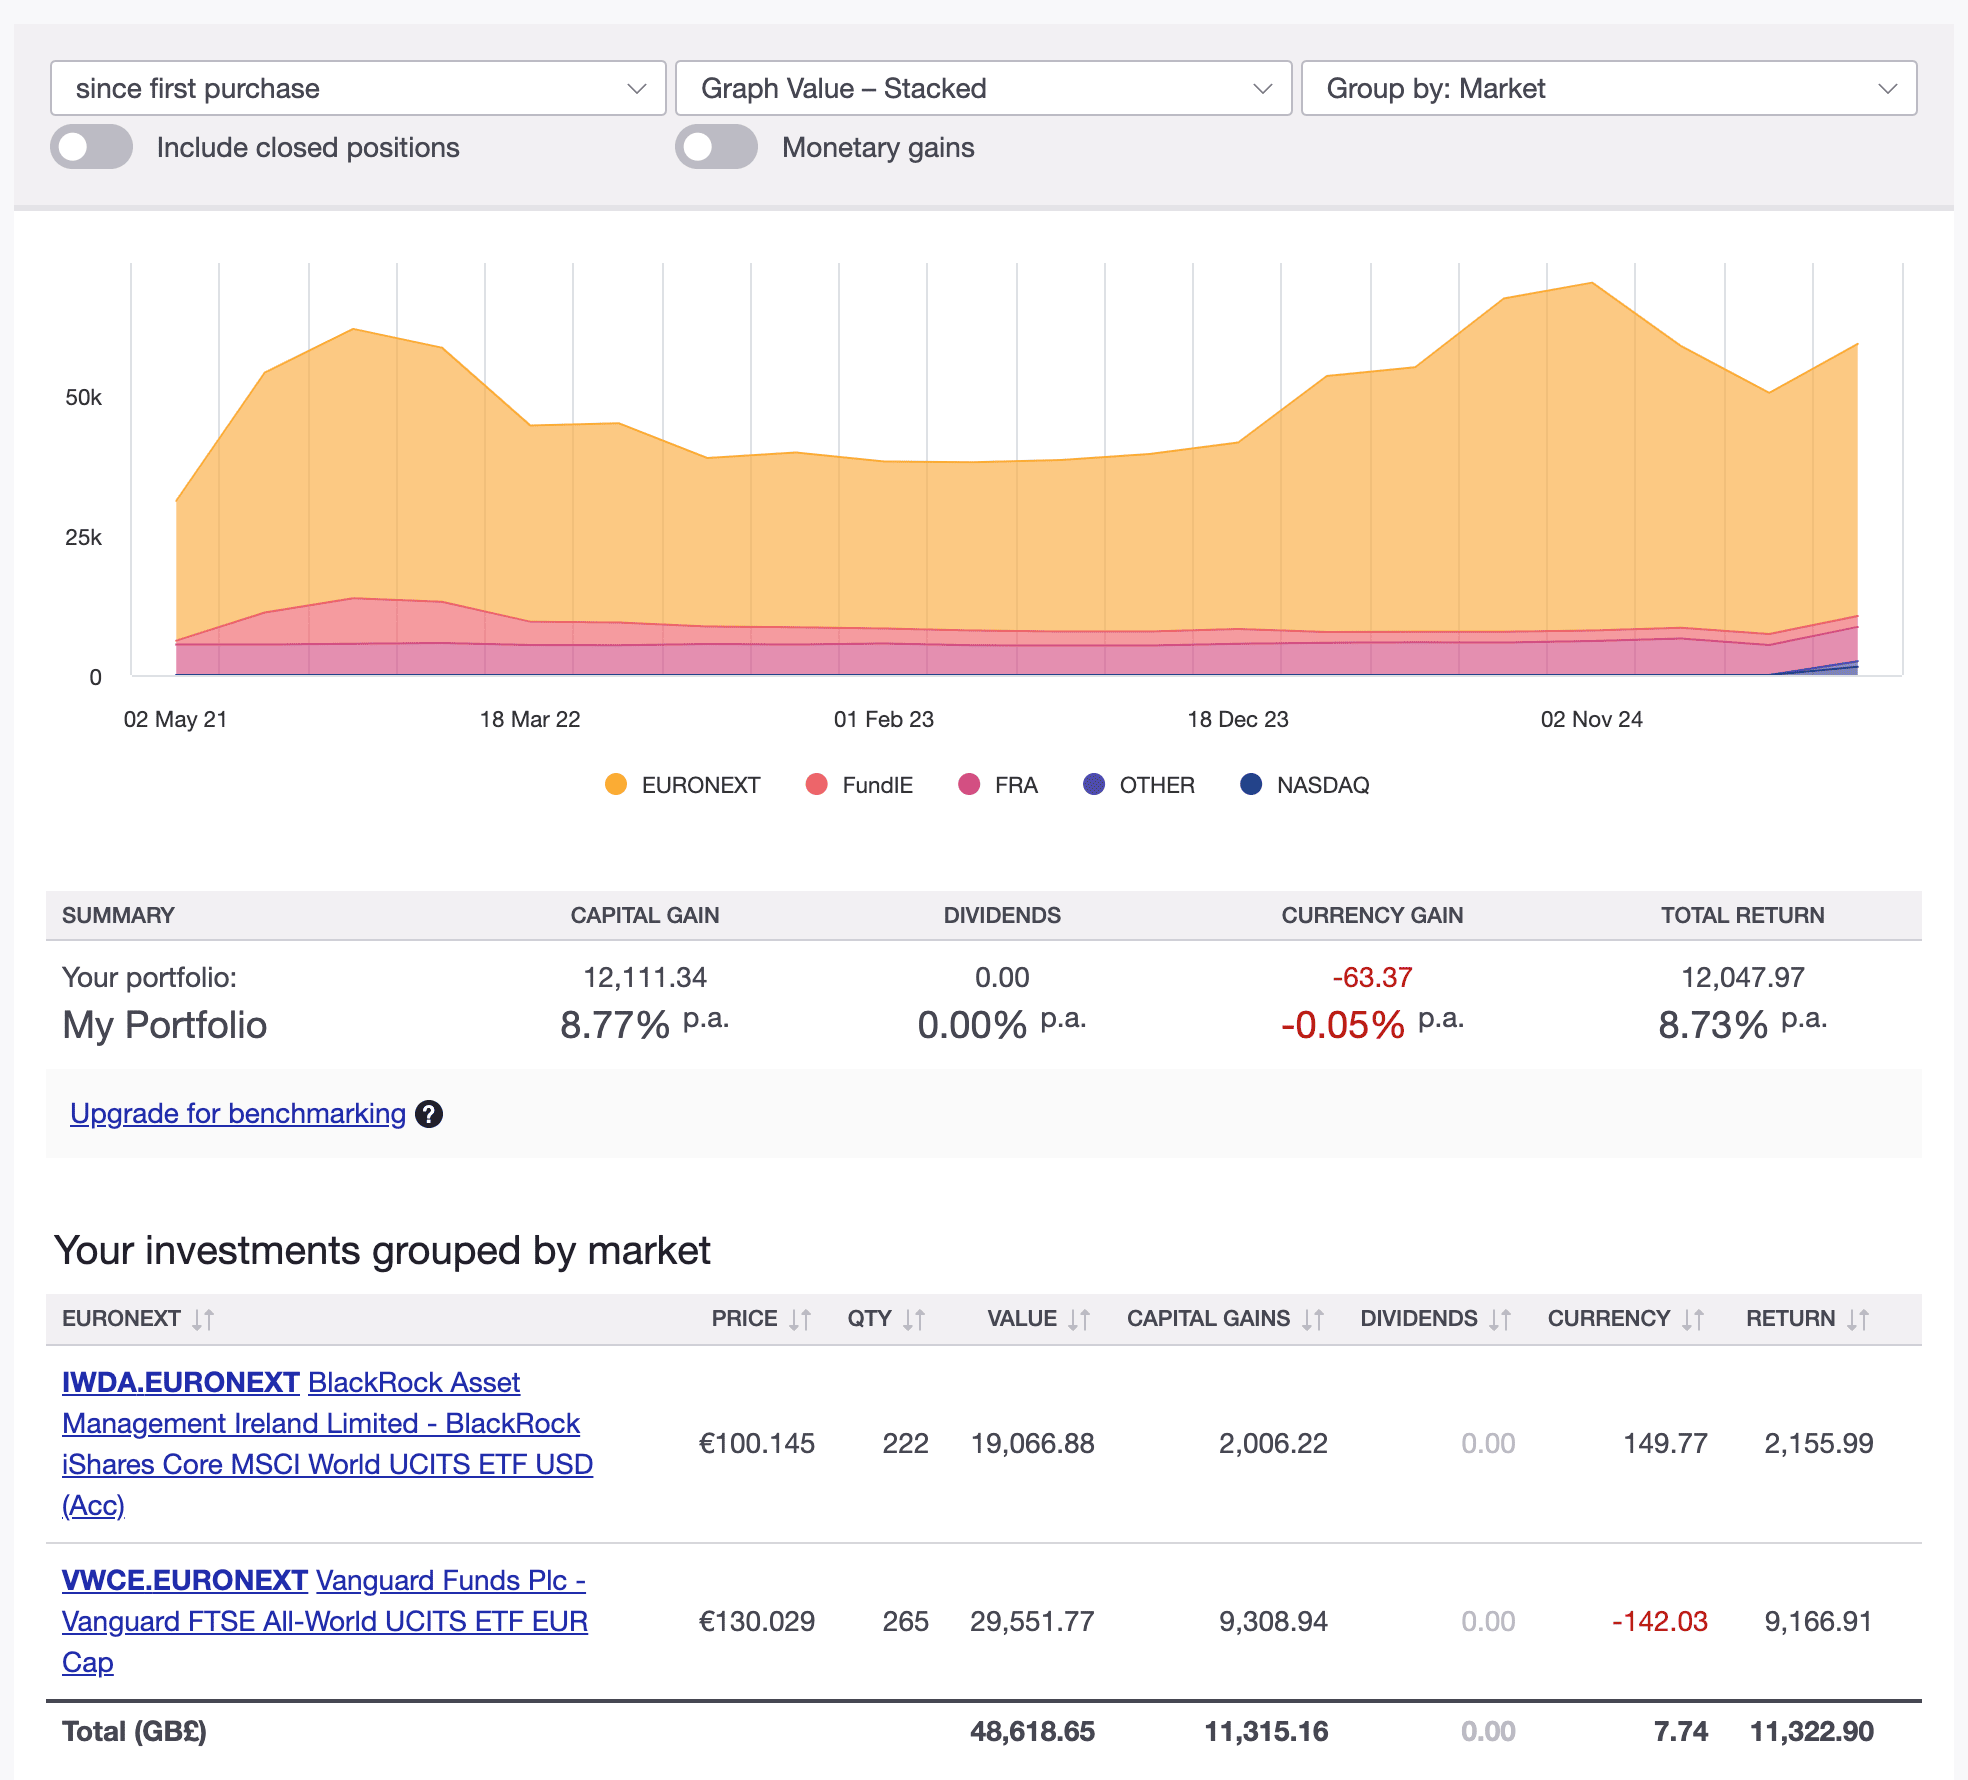
Sharesight pulls in dividend announcements and handles DRIPs by creating corresponding buy transactions. Since a mid-2025 rebuild, its Future Income report shows paid, pending, upcoming, and forecasted dividends together — with predictive estimates up to three years out on paid plans. A 2025 Income Calendar visualizes past and upcoming cashflow, and a Dividend Insights pane shows yield, yield on cost, and next payment date per holding. The platform calculates total return, so income and capital gains are always shown together.
Through 2025–2026 Sharesight expanded beyond equities into fixed income (20,000+ LSE-listed bonds, US bonds), precious metals, and derivatives. Tax reporting remains its standout feature — automatically handling Australian franking credits, country-specific capital-gains reports, and US Form 8949 data.
It still has real gaps. Tracking other income types like rent or P2P interest is limited and manual, forcing them into a stock-like framework. And there's no dividend safety analysis, quality scores, or screening — no way to evaluate a holding's dividend sustainability within the tool.
Overall platform
Sharesight's strength — focus on specific markets — is also its limit. Each portfolio is locked to a single base currency tied to a tax jurisdiction set at creation, which can frustrate international investors, though capital and currency gains are still reported separately. A rebuilt Investments tab (2026) and new mobile apps (2025) have modernized a long-dated interface, but most insights still live inside reports that need parameters set before they show anything. There are no portfolio-strategy or backtesting tools.
Pricing starts with a restrictive free tier (10 holdings). Paid plans run from about $7/month (Starter) to $23.25/month (Premium), billed annually. There's no comprehensive free trial — free users get a shared demo portfolio to evaluate the advanced reports.
Snowball Analytics: Best for European investors who want strategy tools
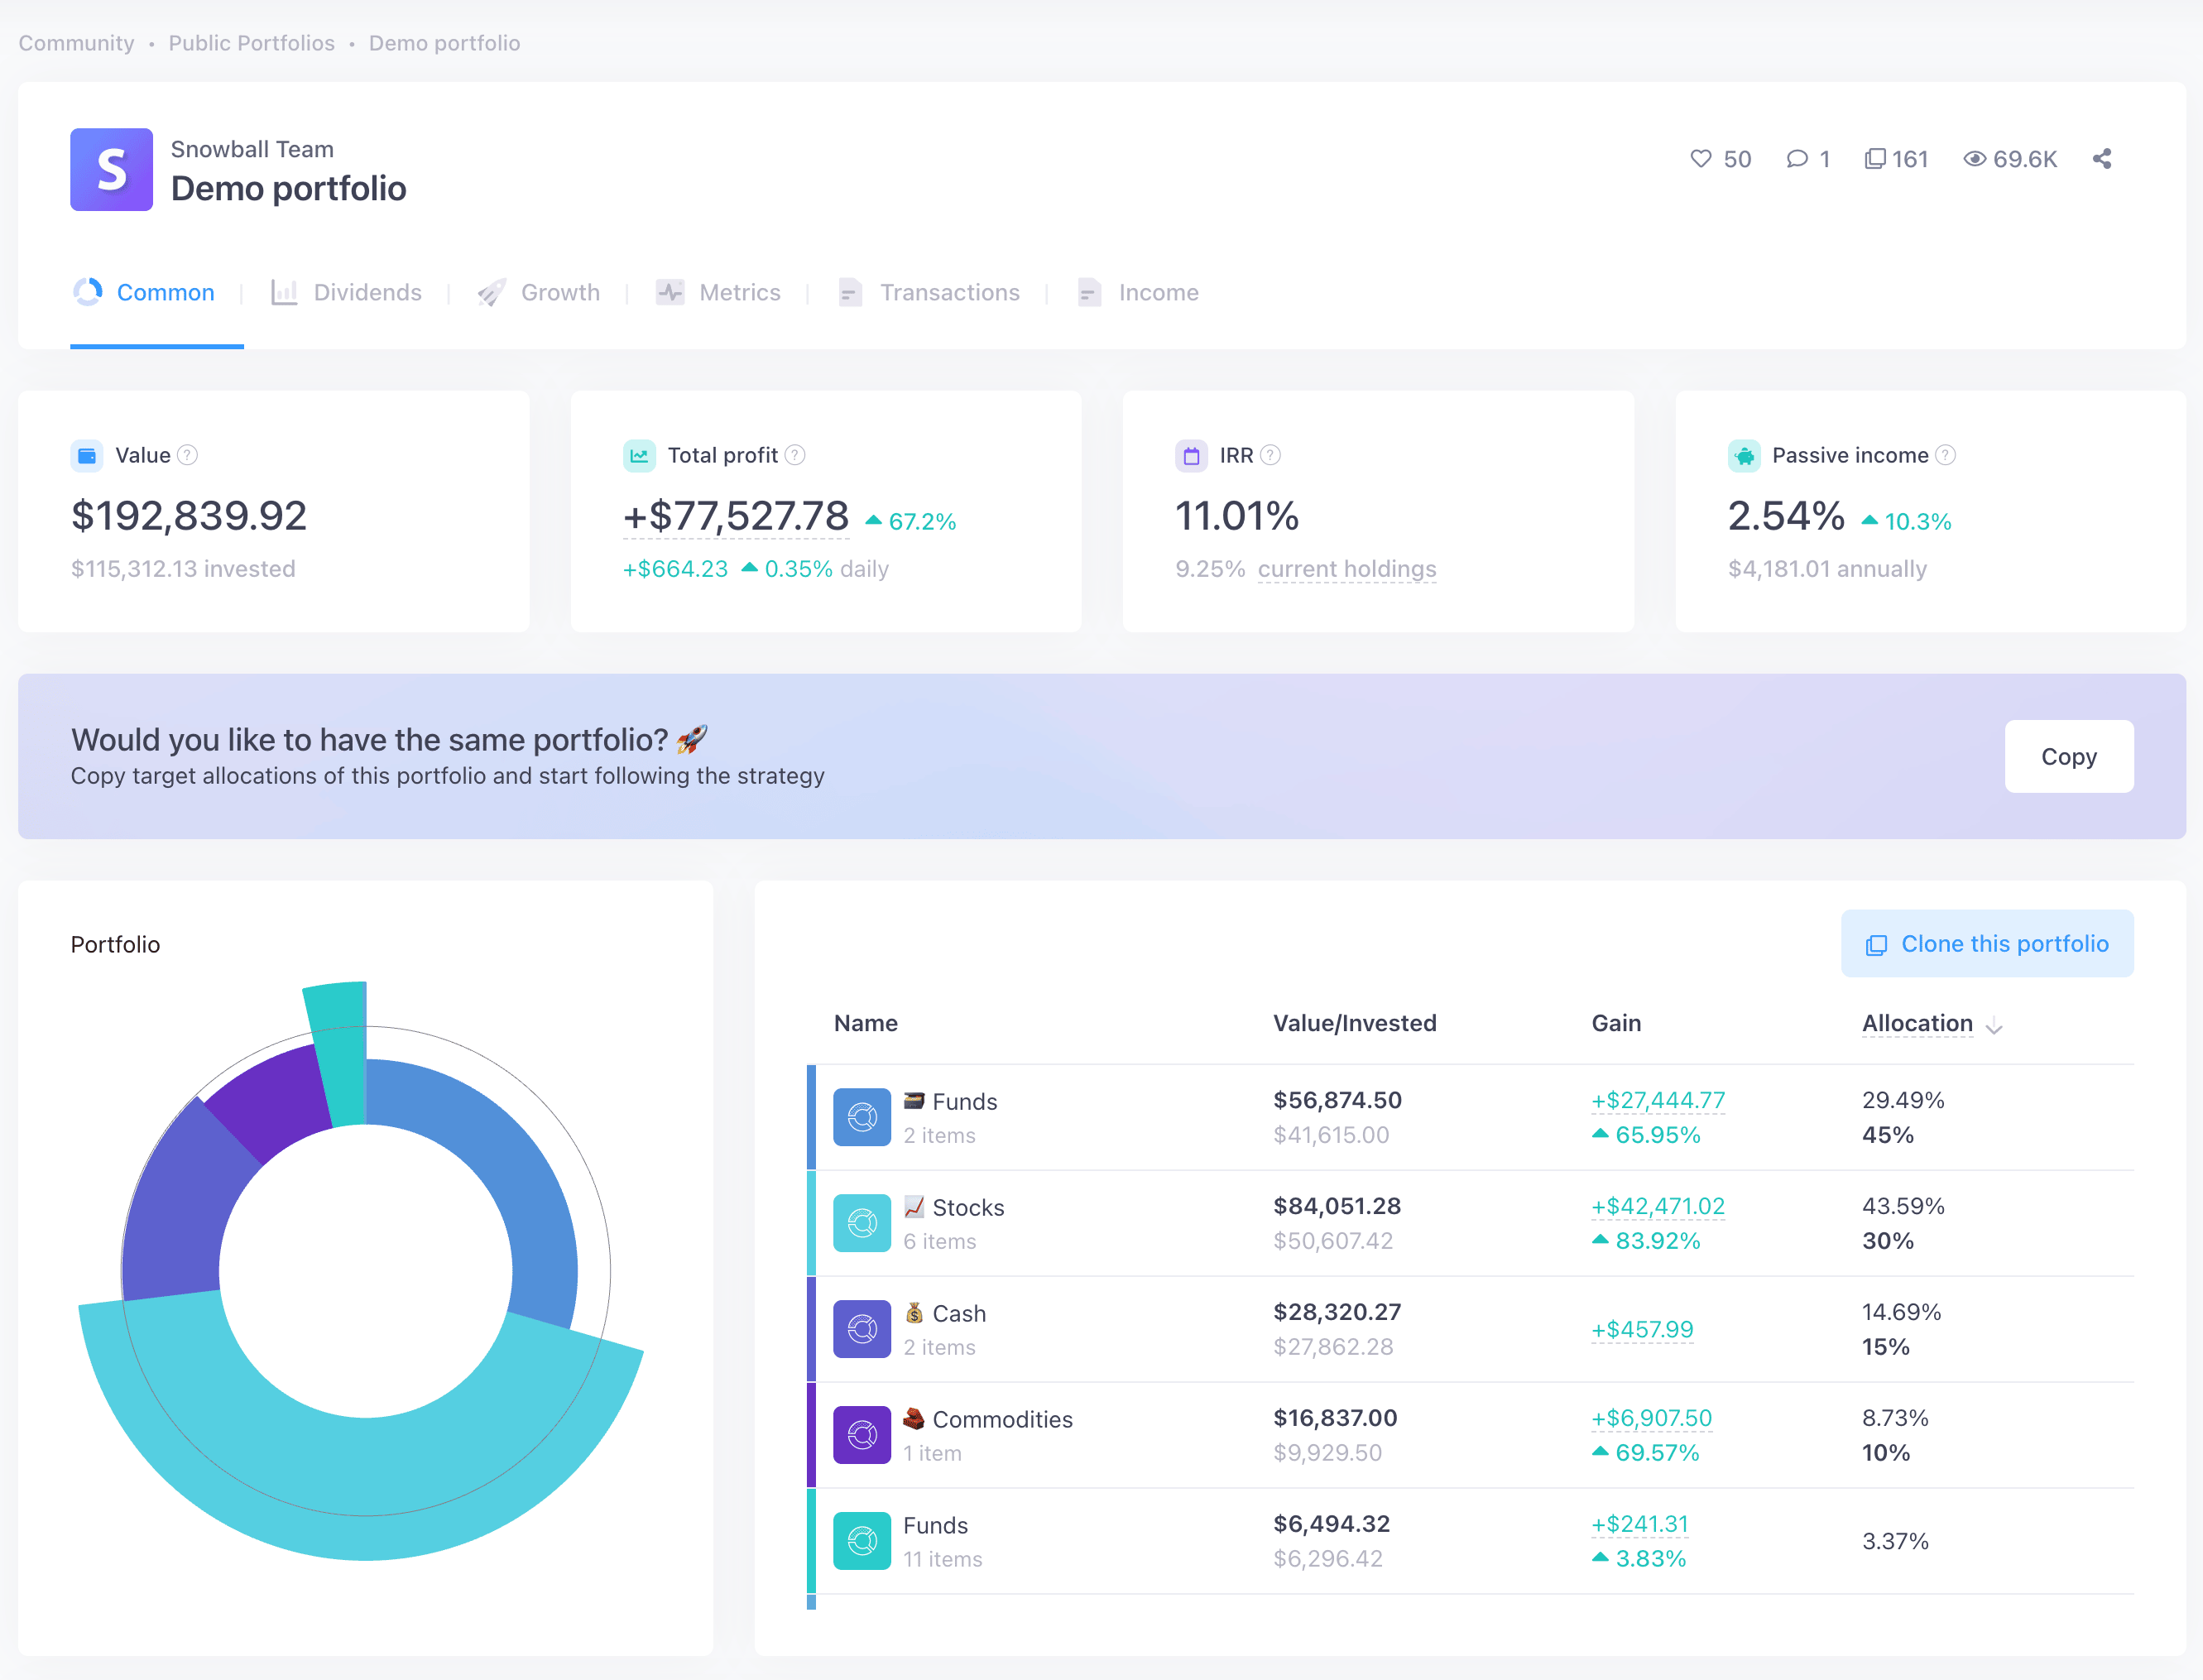
Snowball Analytics is the best dividend tracker for European investors who want portfolio-strategy tools alongside income tracking. Launched in 2022 and based in Lyon, France, it pairs a clean dashboard with target allocations, a rebalancing calculator, and backtesting — plus a proprietary Dividend Rating that scores payout stability.
Dividend tracking capabilities
Snowball provides a solid dividend toolkit: all the standard metrics, a detailed dividend calendar with increase and cut annotations, a 12-month income forecast, dividend event emails, and its Dividend Rating system for assessing payout stability. A passive-income diversification view shows where your income concentrates.
The gaps are in depth. DRIP handling is manual — reinvestments are logged as new trades with no compounding forecast. Custom assets like real estate can be tracked but lack class-specific fields, so rental income gets logged generically rather than as distinct property income. Tax handling is minimal: you can log withholding tax, but there are no cost-basis methods or customizable rules for different countries.
Overall platform
Snowball's differentiator is its strategy tools — target allocations, a rebalancing calculator, and backtesting of asset allocations. That suits investors who want to be hands-on with portfolio construction. Brokers connect through three paths: the Yodlee aggregator, SnapTrade, and — since January 2026 — a native Interactive Brokers integration; the aggregator routes still involve sharing broker credentials with a third party. The interface is clean and modern with a customizable dashboard, though report customization is limited and there are no custom benchmarks or liability tracking.
Pricing is tiered, with a limited free plan and paid plans from $7.99 to $24.99 per month, all with a 14-day free trial.
The Dividend Tracker: Best polished mobile app for US, UK & Canadian investors
The Dividend Tracker is the best choice for a polished mobile experience on a dividend-only portfolio in US, UK, and Canadian markets. With native iOS and Android apps and a clean interface, it's built for one job — tracking dividend income on the go — and does it well within those markets.
Dividend tracking capabilities
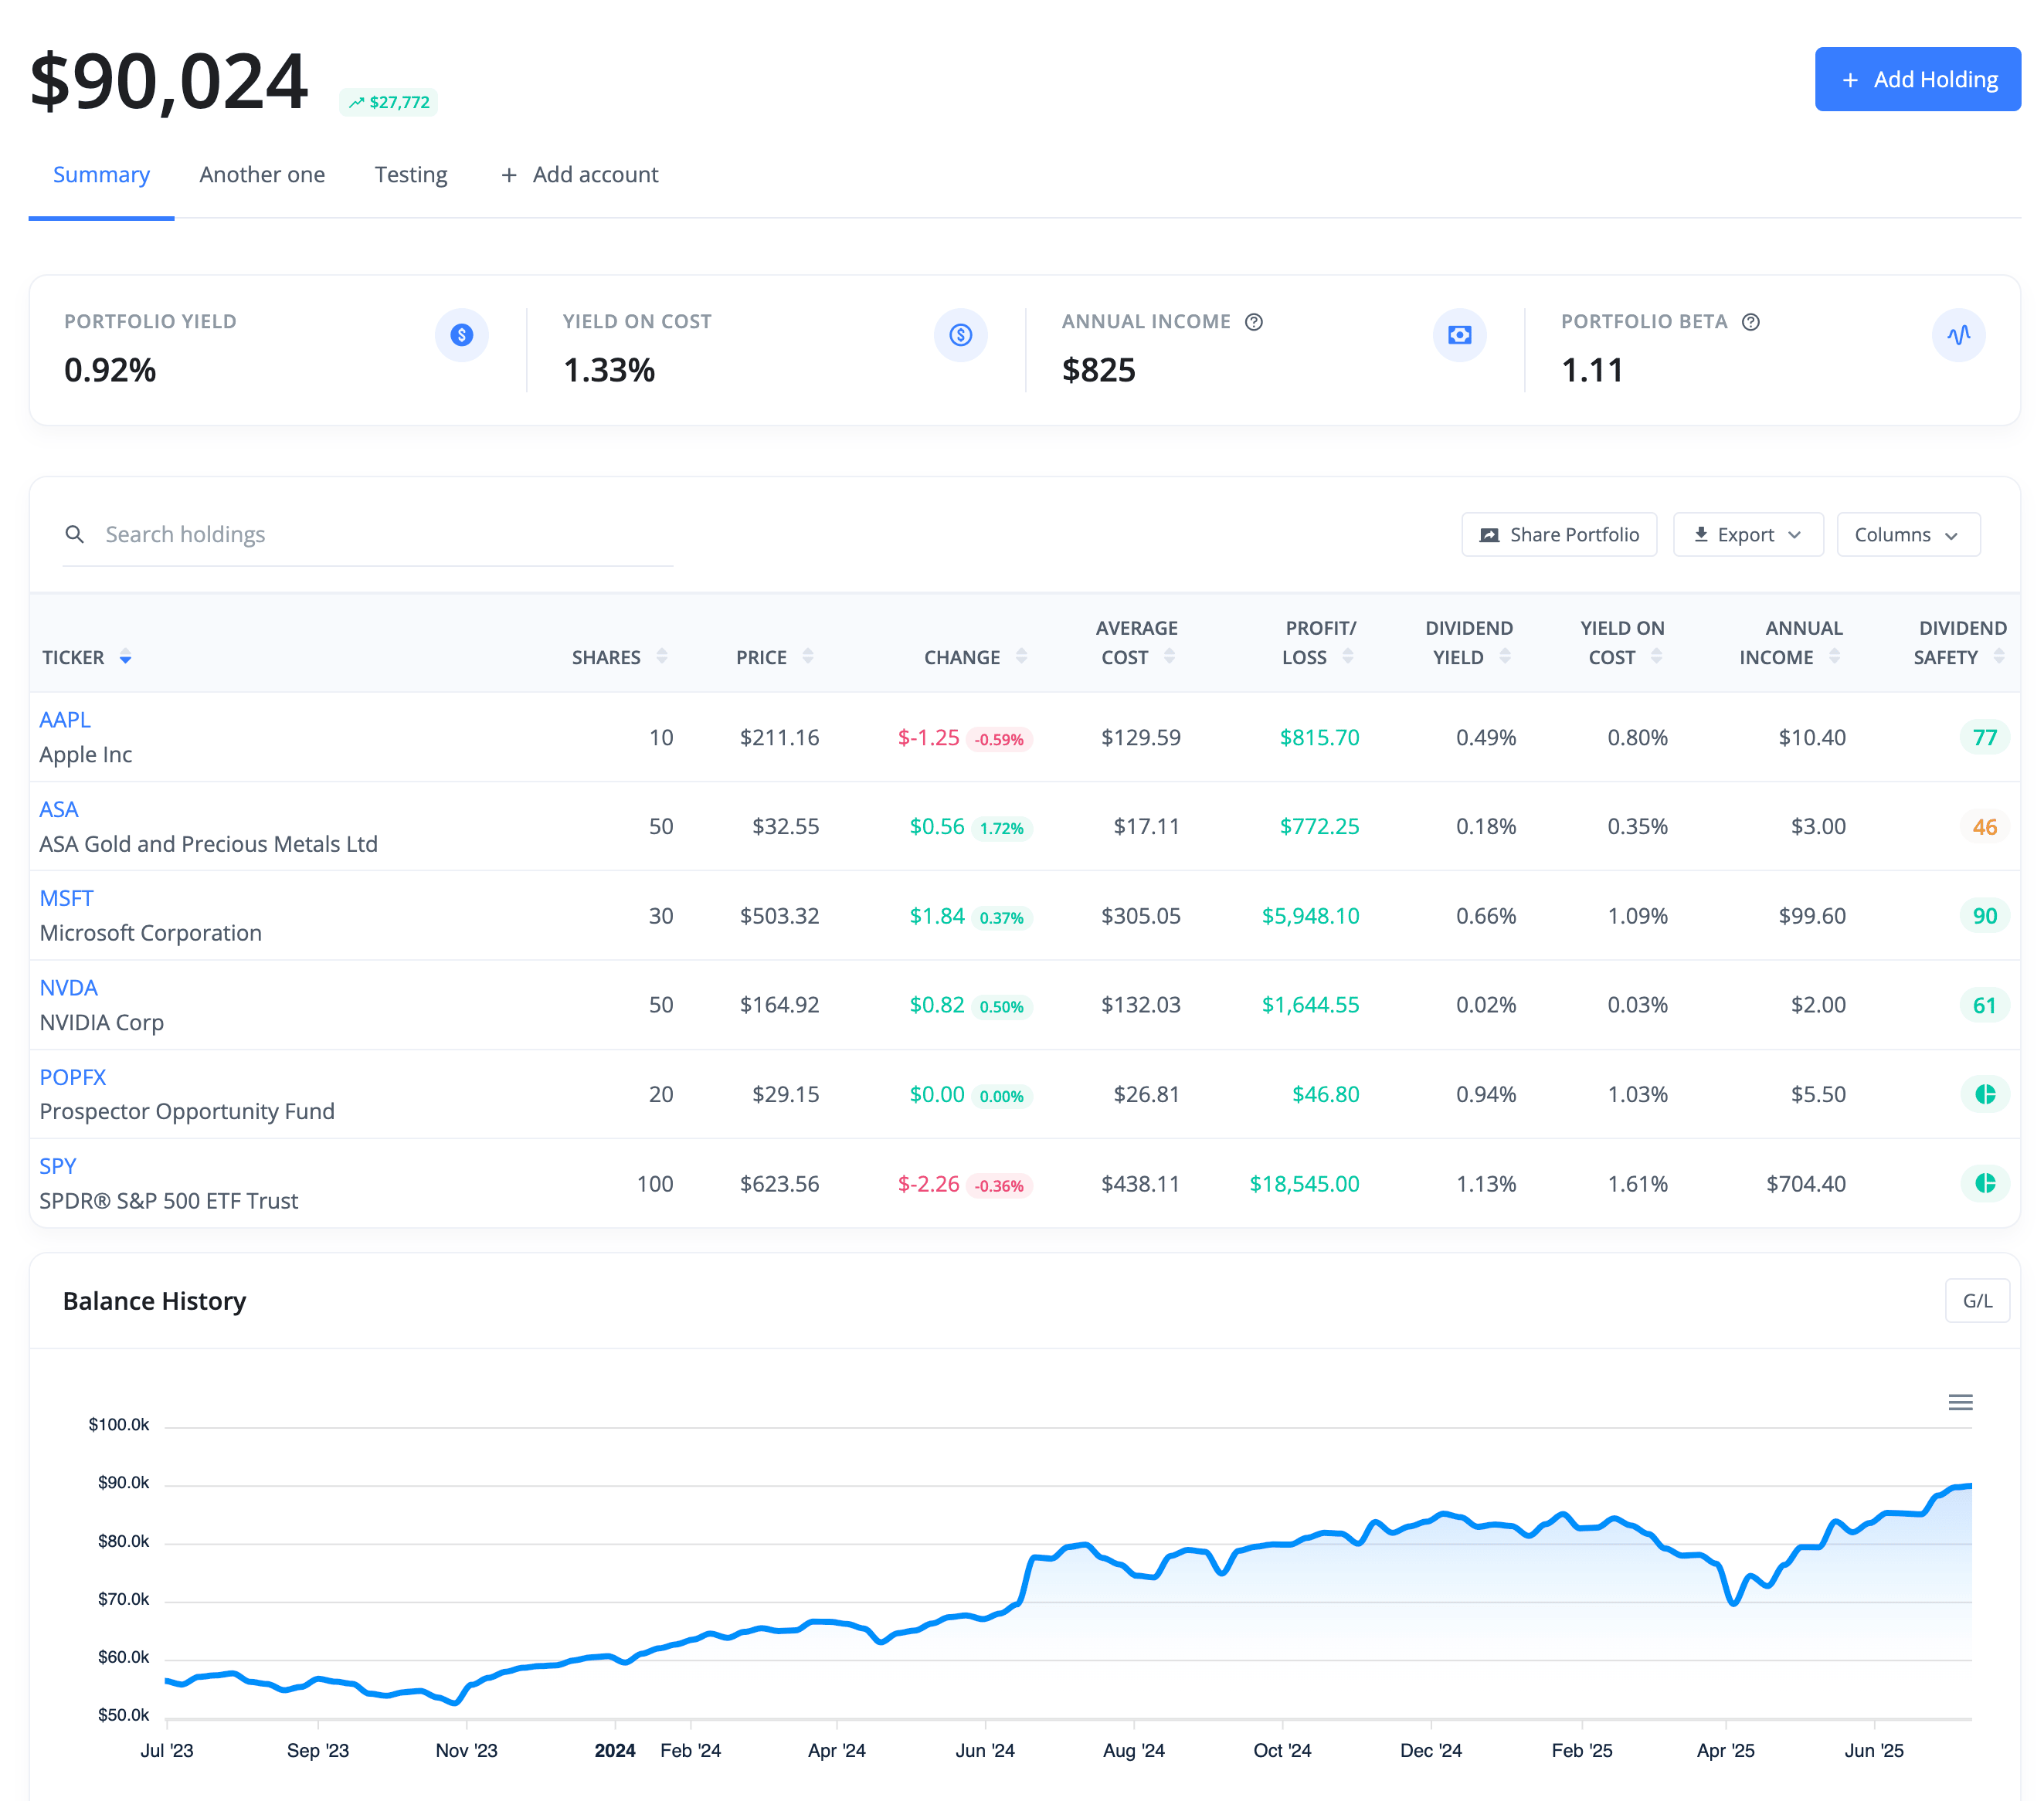
This tool is entirely focused on dividend metrics. It has a good dividend calendar with estimated, declared, and confirmed dates, tracks monthly and yearly income, and includes its proprietary Dividend Grades to assess dividend quality and safety. Coverage spans US, Canadian, and UK markets, and it includes a stock and dividend screener plus basic fundamentals. Long-range backtests are now available on the top tier.
The sharp focus comes with critical blind spots. The platform barely touches capital gains, making total return hard to assess — a high-yield stock could be steadily losing value and you wouldn't easily see it. It imports only current balances with an average cost, not full transaction history, so Yield on Cost isn't based on your actual purchases. It has no DRIP tracking and no meaningful tax features.
Overall platform
The Dividend Tracker is easy to use, and automatic broker connections via Plaid and SnapTrade simplify setup for premium users (if you're comfortable sharing credentials with an aggregator). The free tier is ad-supported and capped at 10 holdings; the $5.99/month Lite tier still shows ads. Removing ads and unlocking auto-import and Dividend Grades starts at $8.99/month (Premium), with a $16.99/month Pro tier adding API access and backtests, plus a one-time Lifetime option.
It's a solid choice for a dividend-only investor who values a polished mobile experience — but it's not a complete portfolio management tool.
Track Your Dividends: Best free starting point for US & Canadian beginners
Track Your Dividends is the best free starting point for US and Canadian beginners who want to start tracking dividend income. Its free tier became genuinely useful after a recent expansion — one linked account, unlimited manual portfolios, income projections, and a dividend calculator — making it an easy on-ramp for a simple US- or Canada-based portfolio.
Dividend tracking capabilities
The platform is built around a dividend income dashboard. It provides a dividend calendar, monthly and yearly income charts, yield-on-cost and dividend growth tracking, and a five-factor Dividend Safety Score (payout ratio, growth streak, 5-year growth rate, EPS trend, and yield). Four screeners help find high-yield stocks in the US and Canadian markets it supports.
It shares the limits of every hyper-focused tracker. It ignores total return, giving an incomplete view of performance. It imports only current balances, so metrics like YOC are approximations. There's no DRIP compounding, no withholding-tax handling, and no support for other income sources — it tracks dividend payments from US and Canadian stocks, and nothing else.
Overall platform
Owned by Chronim Investments since 2021, Track Your Dividends is web-only — responsive in a mobile browser, but with no native apps. Broker connections use Plaid (with SnapTrade in a beta redesign), pulling positions only, not transaction history. Paid plans are $9.99/month or $99.99/year; the 7-day trial requires starting a paid subscription, with a 14-day money-back guarantee.
For investors who need anything beyond a basic, income-only view of a US- or Canada-centric portfolio, the limitations show quickly — but as a free way to start, it does the job.
The verdict: choosing your best dividend tracker
The best dividend tracker depends on your portfolio and your priorities. For a privacy-conscious international investor with income from multiple sources, Capitally is the standout; for jurisdiction-specific tax reporting, Sharesight; for strategy tooling, Snowball Analytics; and for a simple US- or Canada-based start, the specialist trackers.
If you are a privacy-conscious, international investor with a diverse portfolio that generates income from multiple sources — stocks, bonds, rent, staking — Capitally is the standout choice. Its flexibility, multi-currency support with FX attribution, and multi-year forecasting give a complete, accurate picture of your wealth while keeping your data encrypted on your own device. For how it compares across all portfolio types, see our guide to the best portfolio tracker for the modern DIY investor, or the dividend tracking feature in detail.
If you invest mainly in listed securities and your priority is simplified tax reporting for Australia, New Zealand, Canada, the UK, or the US, Sharesight is purpose-built for you.
If you are a European investor who values strategy tools like backtesting and rebalancing and is comfortable with broker aggregation, Snowball Analytics offers a compelling all-in-one package.
The specialist platforms — The Dividend Tracker and Track Your Dividends — serve a narrower niche well: a polished, income-only view for US, UK, or Canadian beginners. Their lack of total-return analysis and inability to track diverse assets make them a starting point rather than a long-term home for serious wealth management.
Frequently asked questions
For most international and privacy-conscious investors, Capitally is the best dividend tracker in 2026 — it forecasts income across stocks, bonds, rentals, and crypto staking, separates currency moves from real returns, and encrypts data on your own device. Sharesight is the better fit if your priority is jurisdiction-specific tax reporting; Snowball Analytics if you want strategy and backtesting tools.
Yes — several dividend trackers have free tiers, though most are limited. Track Your Dividends has the most useful free plan after a recent expansion (one linked account, unlimited manual portfolios, income projections). Sharesight, Snowball Analytics, and The Dividend Tracker also have free tiers, typically capped around 10 holdings. Capitally has no free tier but offers a full-featured 14-day trial with no credit card.
Capitally is the best dividend tracker for international investors because it separates currency gain from capital gain, lets you view returns in any base currency without losing the local-currency truth, and tracks income from any market and asset class. Most dividend-focused competitors lock you to one base currency or a handful of supported markets.
It depends on the tool. Capitally and Sharesight import full transaction history — Capitally from broker statements and CSVs, Sharesight via CSV and broker sync — so metrics like Yield on Cost reflect your actual purchases. The Dividend Tracker and Track Your Dividends import only current balances with an average cost, which makes long-term metrics approximate.
Some do, some don't. Capitally has dedicated support for Dividend Reinvestment Plans and dividends paid in stock, and forecasts the compounding effect. Sharesight handles DRIP by creating matching buy transactions. Snowball Analytics logs reinvestments manually with no compounding forecast, and The Dividend Tracker and Track Your Dividends have no DRIP tracking.
For country-specific tax reports, Sharesight is purpose-built for Australia, New Zealand, Canada, the UK, and the US. For broader, customizable tax handling, Capitally includes capital-gains tax presets for 11 jurisdictions plus a custom tax-rule editor, and records broker-reported withholding tax. Snowball Analytics lets you log withholding tax but has no cost-basis methods; The Dividend Tracker and Track Your Dividends have no tax features.
Ultimately, building passive income is a long-term journey.
Your best bet is to choose a tool that not only serves your needs today but can also grow with you as your portfolio becomes more sophisticated. Take advantage of the free trials, import your real data, and see which platform gives you the most clarity and confidence.