To evaluate a dividend stock, check six key metrics: dividend yield (income now), payout ratio (sustainability), coverage ratio (safety margin), dividend growth rate (income trajectory), dividend ROI (capital recovery), and total return (full picture). A high yield alone tells you almost nothing — quality dividend investing is about combining these metrics to confirm the income is durable.
Most beginning dividend investors fall into the same trap: they focus on one metric (usually yield), skip the rest, and end up holding stocks that cut their dividend a year later. This guide gives you the full toolkit — what each number means, how to calculate it, what range is healthy, and how to use them together.
At a glance: the 6 dividend metrics
Metric | Formula | "Good" range | Best at answering |
|---|---|---|---|
Dividend yield | Annual dividend ÷ price × 100% | 2–5% (most sectors) | What income am I getting today? |
Payout ratio | Dividend ÷ EPS × 100% | <60% (most sectors) | Can the company keep paying? |
Coverage ratio | EPS ÷ dividend | >1.5x (>2.5x ideal) | How big is the safety cushion? |
Dividend growth rate (DGR) | (Current ÷ N-yr-ago)^(1/N) − 1 | 5–10% annually | Will my income grow? |
Dividend ROI | Total dividends ÷ initial investment × 100% | Cumulative | How much capital have I recovered? |
Total return | (End − start + dividends) ÷ start × 100% | Beats benchmark | What's my full performance? |
Table of Contents
- At a glance: the 6 dividend metrics
- Why dividend metrics matter
- Dividend yield
- Dividend yield formula
- How to calculate dividend yield (step by step)
- What is a good dividend yield?
- Why a high dividend yield can be bad: the yield trap
- Dividend payout ratio
- Dividend payout ratio formula
- How to calculate dividend payout ratio
- What is a good payout ratio?
- Why is a high payout ratio dangerous?
- Dividend coverage ratio
- Dividend coverage ratio formula
- What is a good dividend coverage ratio?
- Coverage ratio vs payout ratio: same thing?
- Dividend growth rate (DGR)
- Dividend growth rate formula
- How to calculate dividend growth rate
- What is a good dividend growth rate?
- The power of consistent dividend growth
- Dividend Return on Investment (ROI)
- Dividend ROI formula
- What is a good dividend ROI?
- Dividend ROI vs other return metrics
- Total return
- Total return formula
- Why total return matters even for income investors
- How to choose dividend stocks: combine the metrics
- A quality dividend stock checklist
- Industry benchmarks: what's "normal" by sector
- Special case: REITs and FFO / AFFO
- Frequently asked questions
- Summary: build a quality dividend portfolio
- Your next steps
Why dividend metrics matter
Numbers don't lie. When you analyze dividend metrics you're looking at a company's actual financial behavior — not opinions, predictions, or wishful thinking. Specifically you're checking:
- How much of its profit a company is paying out
- How consistently it has raised those payments
- How sustainable the policy looks going forward
This data-driven approach lets you compare opportunities that look very different on the surface — for example a tech stock with a 1% yield growing 15% a year vs a utility offering 4% with minimal growth vs a REIT yielding 6% with higher volatility. Without metrics, that's a gut call. With metrics, it's a math problem.
Over decades, the real edge of dividend investing emerges. Quality metrics help you find businesses that may not have the highest yield today but have the financial strength to grow dividends substantially over time — which is what builds passive income, beats inflation, and funds retirement.
Dividend yield
Dividend yield is the annual dividend payment expressed as a percentage of the current share price. It tells you how much cash income you receive relative to what you paid for the stock — essentially the "interest rate" on your investment.
Dividend yield formula
Worked example: A company pays $2 in annual dividends. Stock trades at $50.
How to calculate dividend yield (step by step)
- Find the company's most recent annualized dividend (sum the last four quarterly payments, or take the announced annual dividend × payment frequency)
- Find the current share price
- Divide the annual dividend by the share price and multiply by 100
You can also pull this number directly from any major broker or finance site. The trickier question is what the number means.
What is a good dividend yield?
A "good" dividend yield depends entirely on the sector. Here's what to expect:
Yield range | Type of company | What it usually means |
|---|---|---|
0–2% (low) | Tech, consumer discretionary, growth | Reinvesting most profits; dividend may grow fast |
2–4% (medium) | Aristocrats, blue chips, healthcare | Mature company with balanced policy |
4–6% (high) | Utilities, telecom, some financials | Stable cash flows, slower growth |
>6% (very high) | REITs, MLPs, BDCs — or distressed stocks | Often a warning: may signal a coming dividend cut |
A sustainable 3% yield growing at 7% annually will out-pay a static 6% yield within 10 years — and usually with less risk.
Why a high dividend yield can be bad: the yield trap
Beware the dividend yield trap
The most common pitfall: a high yield that comes from a falling share price, not a generous policy. Imagine a stock at $100 paying a $4 dividend (4% yield). The price drops to $50 because the business is struggling. The yield is now 8% — but the dividend is about to be cut.
Real-world dividend traps: many energy companies during oil price crashes, retail companies hit by digital disruption, and specific high-yielders like Frontier Communications or Annaly Capital Management at various points. The yield looked great briefly. The dividend cuts that followed wiped out the apparent advantage many times over.
Rule of thumb: if a stock's yield is more than ~50% above its 5-year average and there's no obvious one-off explanation, treat it as a warning, not a sale.
Dividend payout ratio
The dividend payout ratio is the percentage of a company's earnings paid out to shareholders as dividends. It is the single best quick check on whether a dividend is sustainable.
Think of it like your housing budget. If you spend 30% of your income on housing, that's sustainable. 90% — not sustainable. The payout ratio tells you whether the dividend is in the company's "30% bucket" or its "90% bucket".
Dividend payout ratio formula
Worked example: A company earns $5 EPS and pays a $2 dividend.
The company is paying out 40% of profits — comfortably sustainable.
How to calculate dividend payout ratio
- Find annual dividend per share (sum of last four quarterly dividends)
- Find annual EPS (basic or diluted, usually trailing 12 months)
- Divide and multiply by 100
Equivalent formula at the company level: Total Dividends Paid / Net Income. Use whichever data you have.
What is a good payout ratio?
Payout ratio | Interpretation | Common in |
|---|---|---|
<30% (low) | Very conservative; lots of room to grow dividend | Growth-oriented dividend payers, early-stage payers |
30–60% (moderate) | Sustainable for most established companies | Most blue-chip dividend stocks |
60–80% (high) | Acceptable for stable mature businesses | Utilities, telecom, mature consumer staples |
>80% (very high) | Risk territory; cut likely if earnings dip | Sometimes legitimate (REITs by law), often a warning |
Industry context matters. Utilities and REITs run higher payout ratios by design — REITs are legally required to distribute at least 90% of taxable income per IRS Form 1120-REIT instructions. Tech and consumer discretionary stocks usually run 30–50%.
Why is a high payout ratio dangerous?
A high payout ratio is most dangerous when combined with...
- Declining or stagnant earnings
- Rising debt levels
- Negative free cash flow
- Industry disruption or competitive pressure
- A history of dividend cuts in previous downturns
Any one of these combined with a payout ratio above 80% should put a stock on watch.
Dividend coverage ratio
The dividend coverage ratio measures how many times a company could pay its current dividend out of its earnings. It's the inverse of the payout ratio — same information, different angle, often clearer when comparing companies with different payout policies.
Think of it like an emergency fund. If your monthly expenses are $3,000 and you have $9,000 saved, you have 3x coverage — three months of cushion before things get tight.
Dividend coverage ratio formula
Worked example: EPS of $3.50, dividend of $1.00.
The company earns 3.5 times what it pays out — a comfortable safety buffer.
What is a good dividend coverage ratio?
Coverage ratio | Interpretation |
|---|---|
<1.5x (low) | Little safety cushion; dividend at risk if earnings dip |
1.5–2.5x (moderate) | Adequate for stable businesses |
>2.5x (high) | Strong safety; lots of room for dividend growth |
Coverage below 1.2x deserves real scrutiny regardless of industry — it means almost no buffer against earnings volatility.
Coverage ratio vs payout ratio: same thing?
Coverage ratio and payout ratio: same coin, different sides
Mathematically: Coverage Ratio = 1 / Payout Ratio.
- 25% payout ratio = 4x coverage
- 50% payout ratio = 2x coverage
- 75% payout ratio = 1.33x coverage
- 100% payout ratio = 1x coverage
Why use both? The coverage ratio makes the safety margin easier to visualize — especially in industries where earnings fluctuate a lot (cyclicals), or where regulatory requirements distort earnings (utilities, financials).
Pro tip: for an even more conservative read, calculate coverage using free cash flow instead of earnings. FCF accounts for capital expenditures and tells you what the company can actually afford to pay shareholders, not just what its accountants report.
Dividend growth rate (DGR)
Dividend growth rate measures how quickly a company increases its dividend over time, usually as a compound annual growth rate (CAGR) over a given period. For long-term investors, this often matters more than the current yield — it's the "raise" you receive each year as a part-owner of the business.
Dividend growth rate formula
Where n = number of years.
Worked example: annual dividend grew from $1.00 to $1.50 over 5 years.
The dividend compounded at 8.45% per year over the period.
How to calculate dividend growth rate
- Find the dividend per share
nyears ago - Find the current annual dividend per share
- Divide current by past, take the n-th root, subtract 1, multiply by 100
Most investors check 3-year, 5-year, and 10-year DGR to see whether growth is accelerating, holding steady, or decelerating.
What is a good dividend growth rate?
DGR range | Interpretation |
|---|---|
0–3% (low) | Roughly matches inflation — real income flat |
3–7% (moderate) | Outpaces inflation; sustainable for blue chips |
7–15% (high) | Strong; usually paired with lower current yield |
>15% (very high) | Exceptional but rarely sustainable past 3–5 years |
The power of consistent dividend growth
Two $10,000 investments illustrate why DGR matters more than starting yield:
- Company A: 5% initial yield, 0% growth
- Company B: 2% initial yield, 10% annual dividend growth
Year | Company A income | Company B income |
|---|---|---|
1 | $500 | $200 |
10 | $500 | $518 |
20 | $500 | $1,345 |
By year 20, Company B pays nearly 3x more annual income than Company A — even though its starting yield was less than half. This is why dividend growth investors usually prioritize companies with moderate yields and strong growth over high-yield-no-growth payers.
The consistency of increases also signals discipline. The "Dividend Kings" — 50+ consecutive years of raises — represent the rarest level of management commitment to shareholder returns. Their less-exclusive cousins, the S&P 500 Dividend Aristocrats, require 25+ consecutive years and S&P 500 membership.
When evaluating DGR, also check:
- Is growth accelerating or decelerating?
- Is the dividend growth supported by similar earnings growth?
- How does the rate compare to industry peers?
- Has the company maintained its growth rate through recessions?
Capitally: your dividend metrics command center
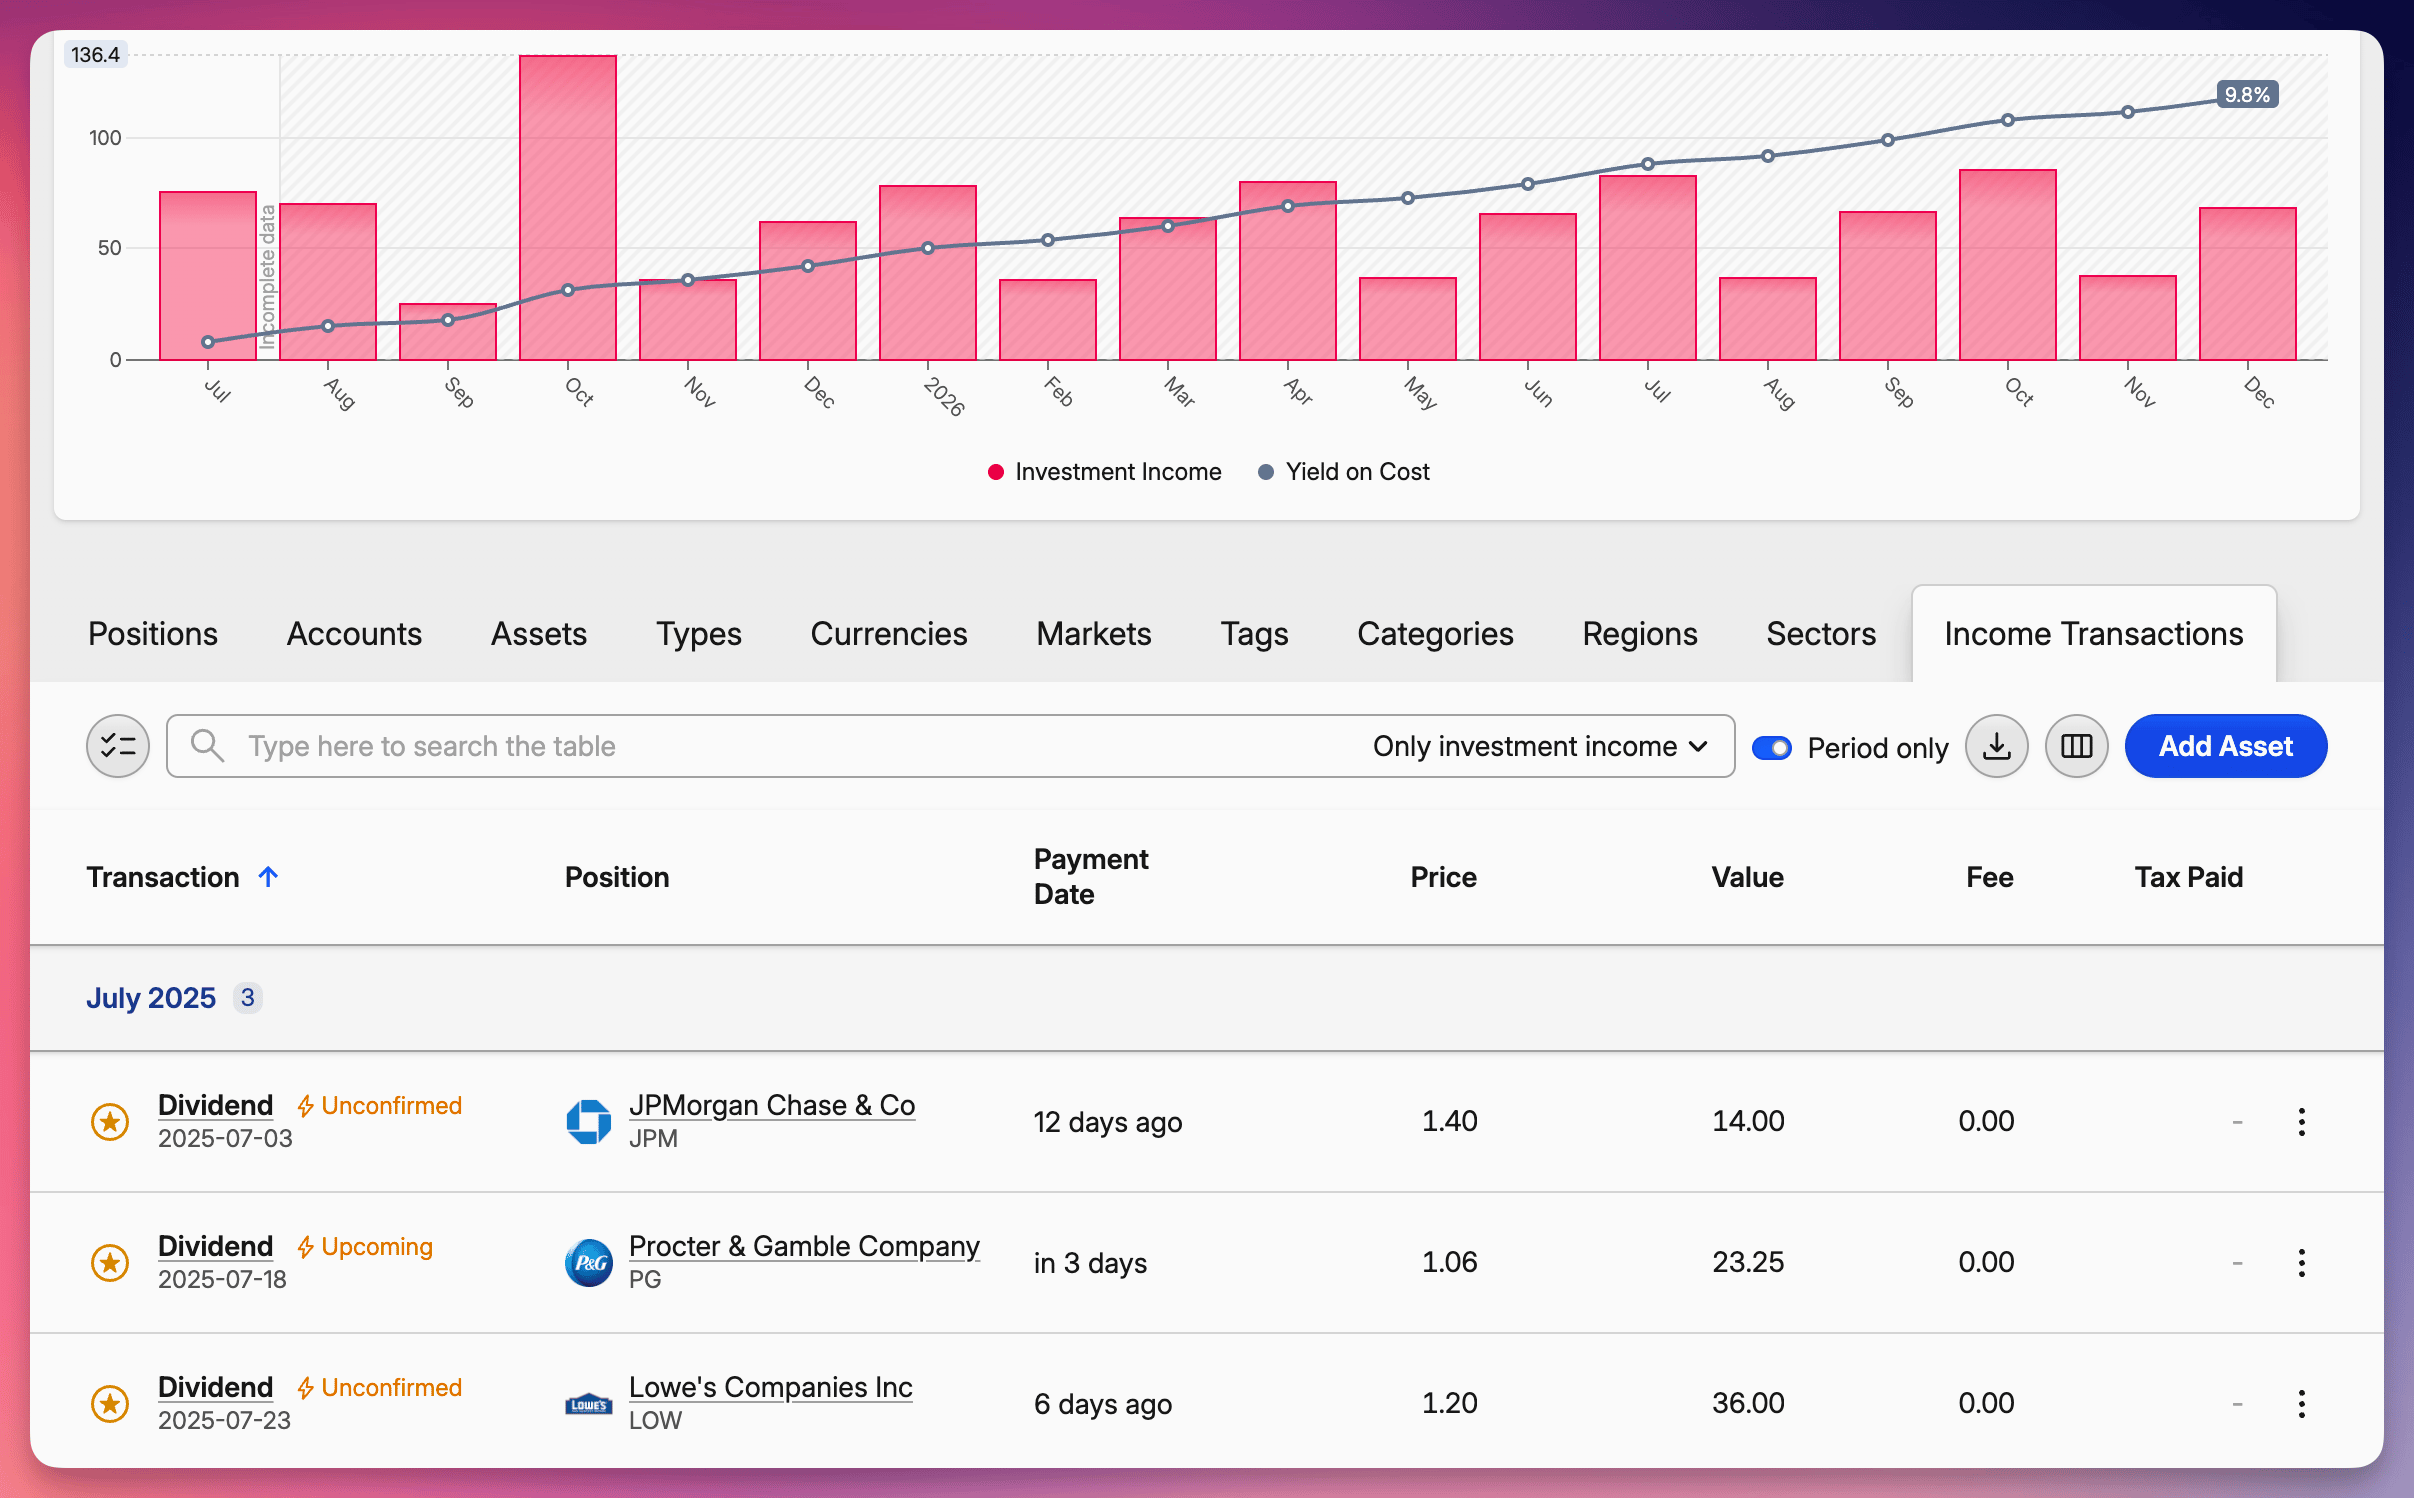
Calculating these metrics by hand for a single stock is fine. Doing it for a whole portfolio every month is not. Capitally automates all six metrics across every position you hold.
What Capitally calculates for you automatically:
Auto-calculated yield, yield on cost, and DGR for every position, with multi-timeframe DGR (3yr, 5yr, 10yr) for benchmarking
Real-time payout ratio with sustainability flags when a holding crosses risk thresholds
Dividend coverage visualization showing the safety buffer for each holding
Dividend calendar with upcoming payments, withholding-tax-aware income forecasting, and ex-dividend date alerts
Portfolio-wide totals — total income, average yield, and growth trends across all holdings
Yield trap detection — flags positions where high yield is driven by price drops, not dividend increases
Dividend Return on Investment (ROI)
Dividend ROI is the total cash return you've earned from dividends relative to your initial investment. It measures how much of your original capital has been returned through dividend payments alone.
Dividend ROI formula
Worked example: $10,000 invested, $2,500 in cumulative dividends received.
You've recovered 25% of your initial investment through dividends alone — independent of what the stock price has done.
What is a good dividend ROI?
Unlike yield or payout ratio, dividend ROI is cumulative and grows with time. There's no single "good" number — what matters is the trajectory and the crossover point when total dividends received exceed your initial investment. Hitting that point means you effectively own your shares "for free" — every future dividend is pure gain on top of recovered capital.
Reasonable benchmarks:
- 3 years: 10–15% Dividend ROI for a 4% yielder with growth
- 10 years: 50%+ Dividend ROI typical for a quality dividend grower
- 20+ years: crossover (100%+) is achievable for the strongest Aristocrats
Dividend ROI vs other return metrics
Metric | What it shows | Time perspective |
|---|---|---|
Dividend ROI | Cumulative cash dividends ÷ original investment | Backward-looking, history-specific |
Yield on cost | Current annual dividend ÷ original price per share | Annual, history-specific |
Current yield | Current annual dividend ÷ today's price | Annual, market-current |
Total return | Price gain + dividends ÷ original investment | Backward-looking, complete picture |
Dividend ROI is what most investors quietly track in their heads — "how much have I made back from this stock in cash?" It also doubles as a psychological anchor during downturns, because it doesn't move when prices crash.
Total return
Total return measures the complete financial result of an investment, combining price appreciation (or depreciation) with all income received. It's the "all-in" number — what your investment actually did, period.
Total return formula
Worked example: bought at $50, now worth $65, collected $10 in dividends along the way.
Investment grew 50% when both price appreciation and dividend income are counted.
Why total return matters even for income investors
Dividends have historically contributed roughly 40% of the S&P 500's total return over the long term (Hartford Funds, "The Power of Dividends: Past, Present, and Future") — a contribution most investors miss when they look only at price charts.
For dividend investors, total return is the reality check. A high-yielding stock that loses significant value can produce a negative total return despite generous payments. The most successful long-term dividend investors maintain awareness of total return while building income — they look for companies that deliver both reasonable dividend growth AND share price appreciation. Historical data for any specific stock (price, splits, dividends paid) can be cross-checked at sources like Macrotrends or each company's own investor-relations page.
Worked example: Johnson & Johnson (JNJ) total return 2018–2022
5-year Total Return for Johnson & Johnson, 2018–2022:
Share price (Jan 2018): $140
Share price (Dec 2022): $177
Price appreciation: $37 (26.4%)
Dividends collected: $19.92 (sum of declared per-share dividends 2018–2022, per JNJ's investor-relations dividend history)
Total Return: ($177 − $140 + $19.92) / $140 × 100% = 40.7%
Price appreciation alone was modest — 26.4%. The dividends added another 14.2 percentage points, lifting the total to 40.7%. That's the "invisible" half of dividend stock returns most investors miss when looking at price charts.
A dividend-paying stock isn't always the best investment if its share price consistently underperforms. Always consider total return potential, not just income.
How to choose dividend stocks: combine the metrics
No single metric tells the full story. The most effective dividend analysis combines them in a clear sequence:
- Start with yield and growth — establish current income and growth trajectory
- Verify sustainability — check payout ratio and coverage ratio for safety
- Examine historical patterns — review dividend history and growth rate consistency
- Calculate long-term value — project total return and dividend ROI over your hold period
- Compare alternatives — use the same metrics to evaluate across the opportunity set
A quality dividend stock checklist
A stock that passes all of these is rare — but every one it fails is a real risk:
- Yield in the 2–5% range (or sector-appropriate)
- Payout ratio below 60% (or sector-appropriate)
- Coverage ratio above 1.5x (above 2.5x for cyclicals)
- Dividend growth rate above 5% annually
- At least 10 years of consecutive dividend increases (Aristocrats: 25+)
- Earnings growth supporting the dividend growth
- Manageable debt and positive free cash flow
- Defensible business model (moat)
Industry benchmarks: what's "normal" by sector
Industry | Typical yield | Typical payout | Typical coverage | Notes |
|---|---|---|---|---|
Utilities | 3.0–4.5% | 60–80% | 1.3–1.7x | Stable, regulated |
REITs | 3.5–6.0% | 80–95%* | 1.0–1.3x (EPS) | *Required by IRS to distribute 90%+ of taxable income; for safety, prefer FFO/AFFO coverage (see below) |
MLPs | 5.0–8.0% | 60–90% | 1.1–1.5x | Higher yield, complex tax forms (K-1) |
Consumer staples | 2.0–3.5% | 40–60% | 2.0–3.0x | Defensive, slow growth |
Healthcare | 1.5–3.5% | 35–55% | 2.5–3.5x | Strong moats, steady |
Financials (banks) | 2.0–4.0% | 25–40% | 3.0–4.5x | Cyclical earnings |
Industrials | 1.5–3.0% | 30–50% | 2.5–3.5x | Cyclical |
Technology | 0.5–2.0% | 15–30% | 4.0–7.0x | Lower yield, higher growth |
Telecom | 4.0–7.0% | 60–80% | 1.3–1.7x | Mature, high payout |
Use these as anchors, not absolute rules. Each cell is the typical cluster of companies inside that sector — they aren't strict mathematical inverses (Coverage = 1 / Payout) because the payout and coverage ranges describe different mid-points of the distribution. Every company also has context that overrides the sector norm.
Special case: REITs and FFO / AFFO
For REITs, GAAP earnings include large non-cash depreciation charges that don't reflect economic reality, which is why EPS-based coverage and payout look alarming for healthy REITs. The industry standard is Funds From Operations (FFO) — GAAP net income plus depreciation and amortization, minus gains on property sales — defined by Nareit. Adjusted FFO (AFFO) further deducts recurring capex to approximate distributable cash flow.
For any REIT, replace the standard checks with:
- AFFO payout ratio — distributions ÷ AFFO; healthy REITs run 70–85%
- AFFO coverage — AFFO ÷ distributions; 1.2–1.5x is comfortable
Most REITs report FFO and AFFO directly in their quarterly supplements. The SEC's investor bulletin on REITs is a good orientation if you're new to the structure.
Worked analysis: Walmart Inc. (WMT)
How the metrics combine in practice — Walmart Inc. (consumer staples):
Inputs:
Current price: $102
Annual dividend: $0.94 per share (post-2024 split; quarterly $0.235)
5-Year DGR: ~5.25%
EPS (TTM): $2.34
Dividend history: 52 consecutive years of increases (Dividend King)
Step 1 — Yield and growth: Yield 0.92% (low). 5-year DGR 5.25%. Yield + Growth ≈ 6.2% — moderate combined return potential.
Step 2 — Sustainability: Payout ratio 40% (very safe). Coverage ratio 2.49x (strong buffer). Both green-light.
Step 3 — Historical pattern: 52 consecutive years of increases. Growth rate held steady through every recession in living memory. Exceptional consistency.
Step 4 — Forward outlook: 5-year projected total return ~6–7% annually (yield + dividend growth + modest price appreciation). DDM at 8% discount = $35.96, well below $102 — meaning the market is pricing in growth and stability rather than headline yield.
Step 5 — Comparison: Yield is below sector average (typical for retail giants). Growth rate matches or exceeds peers. Payout ratio is conservative for consumer staples. Premium valuation reflects defensive business.
Final assessment: WMT is a low-yield, high-quality, very-low-risk dividend payer. Wrong choice for an income-now investor; right choice as a stable core holding for long-term dividend growth. The metrics agree.
Frequently asked questions
A good dividend yield is typically 2–5% for most US blue-chip stocks. Below 2% suggests a growth-oriented company that prefers reinvestment over payouts; above 6% is a warning sign that the price has fallen or the dividend is at risk. Sector context matters: REITs commonly yield 4–6%, utilities 3–4.5%, tech 0.5–2%.
A good payout ratio is under 60% for most industries — that leaves room for the dividend to keep growing even if earnings dip. Utilities and REITs run higher (60–90%) by design; tech companies usually run lower (15–30%). A payout ratio above 80% paired with declining earnings is a red flag.
A high dividend yield is anything above 6% for typical sectors. It can be sustainable in REITs, MLPs, BDCs, and certain financials — but for a regular C-corp, a yield much above 6% is usually a sign the stock price has fallen on bad news, and a dividend cut is more likely than not.
A very high dividend yield often signals a yield trap: the high number isn't from a generous policy — it's from a falling share price. When the price drops because the underlying business is weakening, the dividend usually gets cut soon after, and the stock keeps falling. The headline yield was illusory. Always check whether high yield comes from price drops or genuine dividend increases.
The easiest way is to check the stock's page on any major broker, Yahoo Finance, or a finance site like Finviz or Seeking Alpha. To calculate it yourself, divide the current annualized dividend by the current share price and multiply by 100. If you hold the stock, a dividend tracker like Capitally calculates yield, yield on cost, and after-tax yield automatically.
Dividend yield is the current dividend divided by the current price — what a new investor would receive today. Yield on cost is the current dividend divided by your purchase price — what you receive based on what you paid. Yield on cost only goes up over time, assuming the dividend grows. Long-term holders often have yields on cost far above the market's current yield — that's the math of compounding dividend growth.
They're inverses of each other: Coverage Ratio = 1 / Payout Ratio. A 50% payout ratio equals 2x coverage. The payout ratio is more common for screening (lower is safer); the coverage ratio is clearer for visualizing safety margin (higher is safer). Most professional analysts use both — payout for sustainability, coverage for cyclical and capital-intensive sectors.
Use the formula =annual_dividend / current_price and format the cell as a percentage. The trickier part is sourcing the two inputs live. In Google Sheets, =GOOGLEFINANCE("TICKER", "price") returns the current price, but GOOGLEFINANCE does not expose a dividend-yield attribute for individual stocks (the yieldpct attribute exists only for mutual funds) — you'll need to enter the annual dividend manually from the company's investor-relations page, or use a community add-on that wraps a dividend API. In Microsoft 365 Excel, type a ticker, select the cell, and on the Data tab click Stocks to convert it to the Stocks linked data type, then reference fields directly: =A1.Price and =A1.[Last dividend amount]; no add-in required for current Microsoft 365 subscribers. Older standalone Excel (2019, 2021 perpetual) has no built-in stock data, so you'll need a third-party add-in like Wisesheets or to import data from your broker. If you hold the stock, a tracker like Capitally calculates yield, yield on cost, and after-tax yield automatically across the whole portfolio — no spreadsheet maintenance.
For retirement income, focus on yield, dividend growth rate, and payout ratio together. Yield gives you the income now, growth ensures it keeps up with inflation, and payout ratio confirms it's sustainable. Coverage and total return matter as cross-checks. Many retirees target 3–4% yield with 5–7% growth — generates current income while protecting purchasing power for 20+ years.
Summary: build a quality dividend portfolio
Bringing the six metrics together:
- Dividend yield — current income, but useless in isolation
- Payout ratio — sustainability, the single best safety check
- Coverage ratio — same information, clearer for cyclicals
- Dividend growth rate — long-term income trajectory, often beats high starting yield
- Dividend ROI — cumulative cash returned, your personal recovery rate
- Total return — the all-in performance, the reality check
No single metric tells the complete story. The magic happens when you combine them into a cohesive framework that matches your goals.
Your next steps
- New to dividend investing? Start with the dividend investing strategies guide for beginners
- Apply these metrics to your actual portfolio with a dividend tracker — yield, payout ratio, and DGR are useless if you can't see them across all your positions
- For Capitally users: every metric in this article is auto-calculated for every position you hold — set up your portfolio and the work is done
- Use the industry benchmark table above to evaluate any new dividend stock you're considering
- Backtest your strategy: in Capitally, create separate accounts to compare how different dividend baskets would have performed over 10–20 years
- Monitor against benchmarks — S&P 500 Total Return is the standard yardstick
Good luck with your investments.