StockMarketEye shut down in September 2023. If you tracked your portfolio there, your migration is long overdue - but the good news is that the tools worth moving to have only improved since. This guide compares five investment trackers as replacements, each scored against the same 18-point checklist so you can match one to how you actually invest.
StockMarketEye was a desktop app built around stock and ETF watchlists, charts and fundamentals. No single tool replicates it exactly, and that's fine: the right replacement depends on whether you pick your own stocks, track a whole multi-asset net worth, invest globally, or care most about where your data lives. Here are the five alternatives, in alphabetical order:
- Capitally pairs on-device end-to-end encryption with first-class support for options, private equity and liabilities - built for privacy-conscious investors with complex, multi-currency portfolios.
- Kubera is the simplest way to see a whole net worth in one place, syncing balances automatically across banks, brokers and crypto wallets.
- Portfolio Performance is a free, open-source desktop tracker that keeps every byte of data on your own machine - for power users who don't mind a learning curve.
- Stock Rover is a US-focused research powerhouse with 700+ fundamentals, deep screeners and technical indicators.
- Sharesight automates dividend and corporate-action tracking and produces country-specific tax reports for Australia, New Zealand, Canada, the UK and the US.
If you just need to get your data out and into a modern tracker quickly, the step-by-step guide to switching from StockMarketEye to Capitally walks through the import.
In the interest of full transparency: I'm the founder of Capitally, one of the apps featured in this guide. My aim is to analyse every option fairly. I believe Capitally brings real strengths to the table - but it isn't the right fit for everyone, and the comparison below is honest about where it falls short.
Table of Contents
- How to choose a StockMarketEye alternative
- StockMarketEye alternatives at a glance
- Capitally - best for privacy-conscious investors with complex portfolios
- Kubera - best for hands-off net-worth tracking
- Portfolio Performance - best free, open-source tracker
- Stock Rover - best for US stock pickers
- Sharesight - best for automated dividend and tax reporting in supported countries
- Frequently asked questions
- Final words
How to choose a StockMarketEye alternative
The best StockMarketEye alternative is the one that matches how you invest: a stock picker needs screeners and fundamentals, a global investor needs real multi-currency support, and a privacy-conscious investor needs to know exactly where their data lives. There's no universal winner - so it pays to decide which of the criteria below actually matter to you, and ignore the rest.
Here's the 18-point checklist used to assess every tool:
- User Interface: Both functionality and aesthetics - the overall user experience.
- Historical Transactions Support: Necessary for precision or for doing taxes. If you only need a general overview, tracking every detail can be overkill.
- Stock Market Tracking: Keeping stock prices, dividends and splits current, ideally automatically.
- Tracking Other Wealth Components: Most of us own more than stocks - real estate, retirement funds, private deals. To understand where you actually stand, you'll want to track those too.
- Multiple Account Tracking: Consolidating and monitoring several accounts in one place, invaluable when your investments are spread across platforms.
- Account Organisation: Organising accounts, portfolios and assets for easy navigation and meaningful comparisons.
- Multi-Currency Support: Handling transactions in different currencies and switching between them - essential for global investors.
- User-Friendly Performance Reports: Reports that are detailed, customisable and actually readable.
- Benchmarks Support: Comparing your performance against a known benchmark to put your numbers in context.
- Tax Handling: A reliable source of truth for filing taxes on your investments, or at least being prepared to.
- Importing Transactions: An easy way to import transactions from a broker, another app or a spreadsheet.
- Minimal Maintenance Required: How little manual upkeep the tool demands.
- Privacy and Data Encryption: Whether the tool genuinely protects your financial data - and how.
- Portfolio Diversification Reports: Understanding your true exposure, useful for managing risk.
- Technical Chart Indicators: SMA, EMA, RSI and similar - important for technical analysis.
- Stock Fundamentals: Access to fundamental stock data for those who invest on fundamentals.
- Watchlists & Price Alerts: Keeping an eye on specific stocks you don't own yet.
- Pricing: Whether the features are proportionate to the cost.
Each tool is rated on every point with a simple scale:
- ❌ Not solving it
- 🤏 Partial - needs workarounds or compromises
- ✅ Does the job well
- ⭐ Best-in-class (only one tool can earn it per criterion)
StockMarketEye alternatives at a glance
Capitally is the broadest and most privacy-focused option, Kubera the simplest, Portfolio Performance the most private and the only free one, Stock Rover the deepest for US stock research, and Sharesight the strongest for dividend and tax reporting on listed securities. The table below summarises where each tool leads and where it falls short.
Capability | Capitally | Kubera | Portfolio Performance | Stock Rover | Sharesight |
|---|---|---|---|---|---|
Best for | Privacy + complex, multi-currency portfolios | Hands-off whole-net-worth snapshot | Free, local, power-user control | US stock pickers and screening | Dividend & tax reporting for listed stocks |
Privacy & data model | On-device end-to-end encryption (cloud) | Standard; data on Kubera servers; aggregator logins | Fully local - no servers, no account | Standard; credentials held by Yodlee | Standard; data on servers; loads ad trackers |
Asset breadth | Almost anything - stocks to options, PE, property, loans | Broad, incl. crypto/NFT, vehicles, PE (Carta) | Stocks, ETFs, funds, bonds, crypto; rest as custom | US & Canada stocks, ETFs, funds only | Listed stocks/ETFs/funds, bonds, metals; alts manual |
Liabilities & debt | First-class (loans, mortgages, margin) | Manual, balance-only | ❌ | ❌ | ❌ |
Multi-currency & FX | Mixed currencies; FX vs capital return split | View in a few currencies; no FX analysis | Strong; ECB rates; capital vs currency gains | USD reporting base only | One fixed base currency per portfolio |
Dividends | Auto + DRIP, calendar, forecast, withholding tax | Not separated from cashflows | First-class; gross, withholding, net | Assumes DRIP; yield metrics; no calendar | Automatic, corporate actions, forecast, calendar |
Tax handling | 11 jurisdictions, customisable, tax-loss harvesting | ❌ | FIFO/avg cost; no country reports | Minimal - basic cost basis only | Country reports for AU/NZ/CA/UK/US |
Market data & sync | Delayed; manual statement import (70+ brokers) | End-of-day; auto balance sync (9 aggregators) | End-of-day; manual file/PDF import | Near-real-time; position-only sync (Yodlee) | Delayed; email/CSV broker sync (~240) |
Stock research | ❌ | ❌ | ❌ | 700+ fundamentals, screeners, technicals | Basic fundamentals (ASX/NZX only) |
Platforms | Web + offline PWA, 7 languages | Web + PWA (no native app) | Desktop (Win/Mac/Linux) + view-only mobile | Browser only; no native app | Web + native iOS/Android apps |
Pricing | ~$80-$250/yr, 3 plans, 14-day trial | $250/yr (Black $2,500); no free tier | Free & open-source (paid mobile add-on) | Free plan; ~$80-$280/yr | Free plan; ~$84-$279/yr |
Capitally - best for privacy-conscious investors with complex portfolios
Capitally is best for privacy-conscious investors with complex, multi-currency portfolios who want to see the math behind every number. Founded in 2023, it tracks almost any asset class - stocks, ETFs, options (with Greeks), private equity, real estate and loans - behind on-device end-to-end encryption that even Capitally itself can't read. The trade-off is a hands-on workflow: there's no automatic broker sync, and no stock screeners or technical indicators for picking individual stocks.
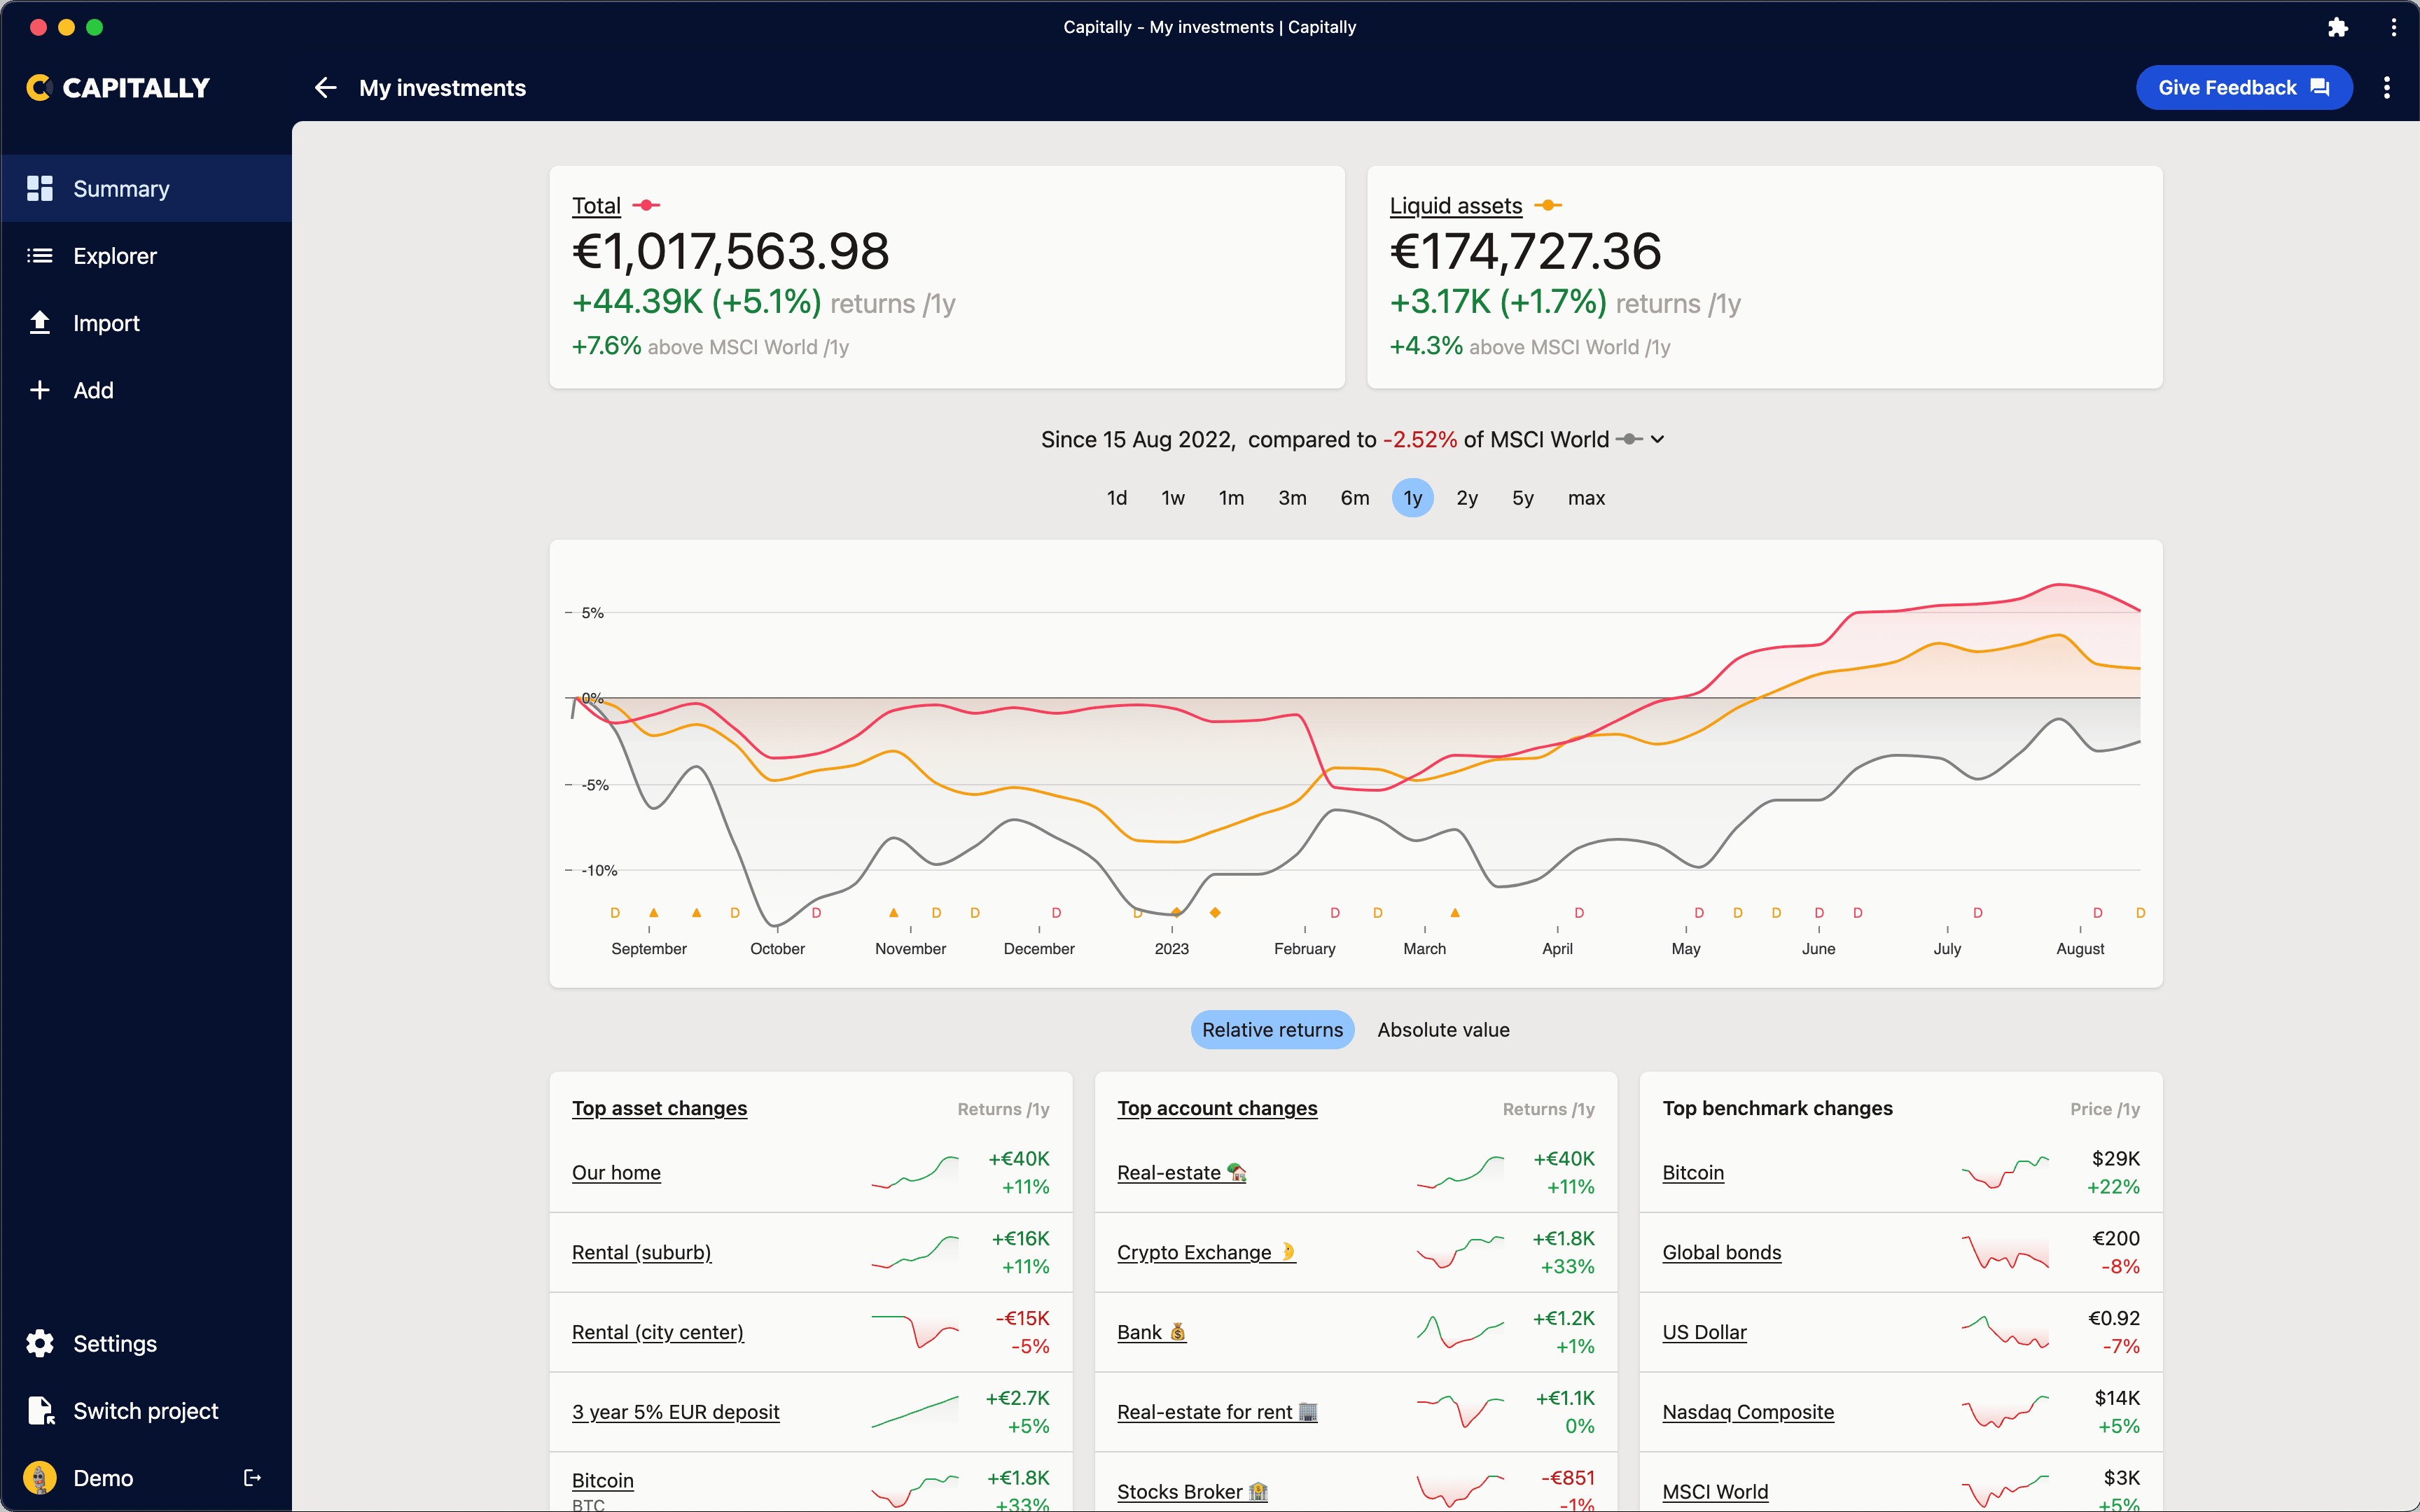 Capitally portfolio tracker dashboard
Here's how it scores on the checklist:
- ✅ User Interface: A modern, exploration-first interface with deep customisation - reorderable columns, custom charts, views and tables. The web app runs on desktop and mobile, installs as a Progressive Web App and works offline. Available in 7 languages.
- ⭐ Historical Transactions Support: Import full transaction history or just balances, depending on the detail you need. A dedicated Project History page lets you search every change, drill into any asset's edit history, and revert the whole project to an earlier point in time.
- ✅ Stock Market Tracking: Global tracking of stocks, ETFs, cryptocurrencies and stock options (with Black-Scholes-Merton pricing and Greeks), with automatic dividends and splits. Prices are delayed - roughly 30 minutes for US markets, end-of-day elsewhere.
- ⭐ Tracking Other Wealth Components: Track almost anything alongside stocks - real estate and rental income, private equity (a dedicated asset type with full lifecycle), bonds, loans, art, collectibles and any custom asset, each with its own prices and transactions.
- ✅ Multiple Account Tracking: Unlimited accounts of any type - brokerage, retirement, bank, 401k - and a single asset can even be tracked across several accounts. Separate projects keep unrelated portfolios apart.
- ⭐ Account Organisation: Organise assets, accounts and individual transactions with hierarchical tags. Market assets are auto-classified into editable categories, regions and industries - and you can apply those taxonomies to custom assets too.
- ⭐ Multi-Currency Support: Transactions, prices, fees and reports can all mix currencies, and you can switch your viewing currency at any time. A dedicated currency-returns metric separates the FX impact from the underlying capital return.
- ⭐ User-Friendly Performance Reports: Predefined reports cover allocation, returns heatmaps and month-by-month performance, with MWR, TWR, IRR and ROI plus 1m-5y period columns. Custom charts and the pivot-style Portfolio Explorer let you slice the data any way you like.
- ⭐ Benchmarks Support: Use any asset, index, custom asset or even part of your portfolio as a benchmark - up to 10 at once. A Position-Prices benchmark shows "what if I hadn't traded?", and built-in economic indicators (inflation, rates, GDP) for 60+ countries let you discount returns to see them in real terms.
- ⭐ Tax Handling: Built-in capital-gains presets for 11 countries (the US, UK, Netherlands, Poland, Germany, France, Canada, Australia and more), FIFO/LIFO/average/specific-lot cost basis, and fully customisable tax logic. A tax-loss harvesting view shows exactly how many shares to sell for a target tax outcome.
- ✅ Importing Transactions: A column-matching importer handles CSV, Excel and copy-pasted spreadsheet data, with reusable templates - including a built-in one for data exported from StockMarketEye. Imports can be reviewed before committing and undone in one click.
- 🤏 Minimal Maintenance Required: There's no automatic broker sync - you export a statement from your broker and import it. Reusable templates make this quick, but it's still a manual step whenever you trade.
- ✅ Privacy and Data Encryption: Capitally is the only cloud tool here with on-device end-to-end encryption: your data is encrypted with a key derived from your password that never leaves your device, so even Capitally can't read it. Servers are in the EU, with no ads and no third-party trackers.
- ✅ Portfolio Diversification Reports: Market assets are automatically categorised by region, sector and category, and you can edit those categories or apply them to custom assets. There's no look-through into the underlying holdings of an ETF.
- ❌ Technical Chart Indicators: Not available.
- ❌ Stock Fundamentals: Not available.
- ❌ Watchlists & Price Alerts: Not available - though you can schedule recurring portfolio-summary notifications.
- ✅ Pricing: Three plans - Sailor, Navigator and Captain - from roughly $80 to $250 a year, with a 14-day trial and no credit card required. Higher tiers add more projects, longer history and advanced features like private-equity and options tracking.
Kubera - best for hands-off net-worth tracking
Kubera is best for investors who want the simplest possible view of their whole net worth without maintaining a transaction ledger. It syncs balances automatically across banks, brokerages and crypto wallets, values hard-to-price assets with an AI Appraiser, and adds estate-planning touches like its "Life Beat" handover. The trade-off is depth: there's no transaction history, no real tax reporting, and your data lives on Kubera's servers rather than being end-to-end encrypted.
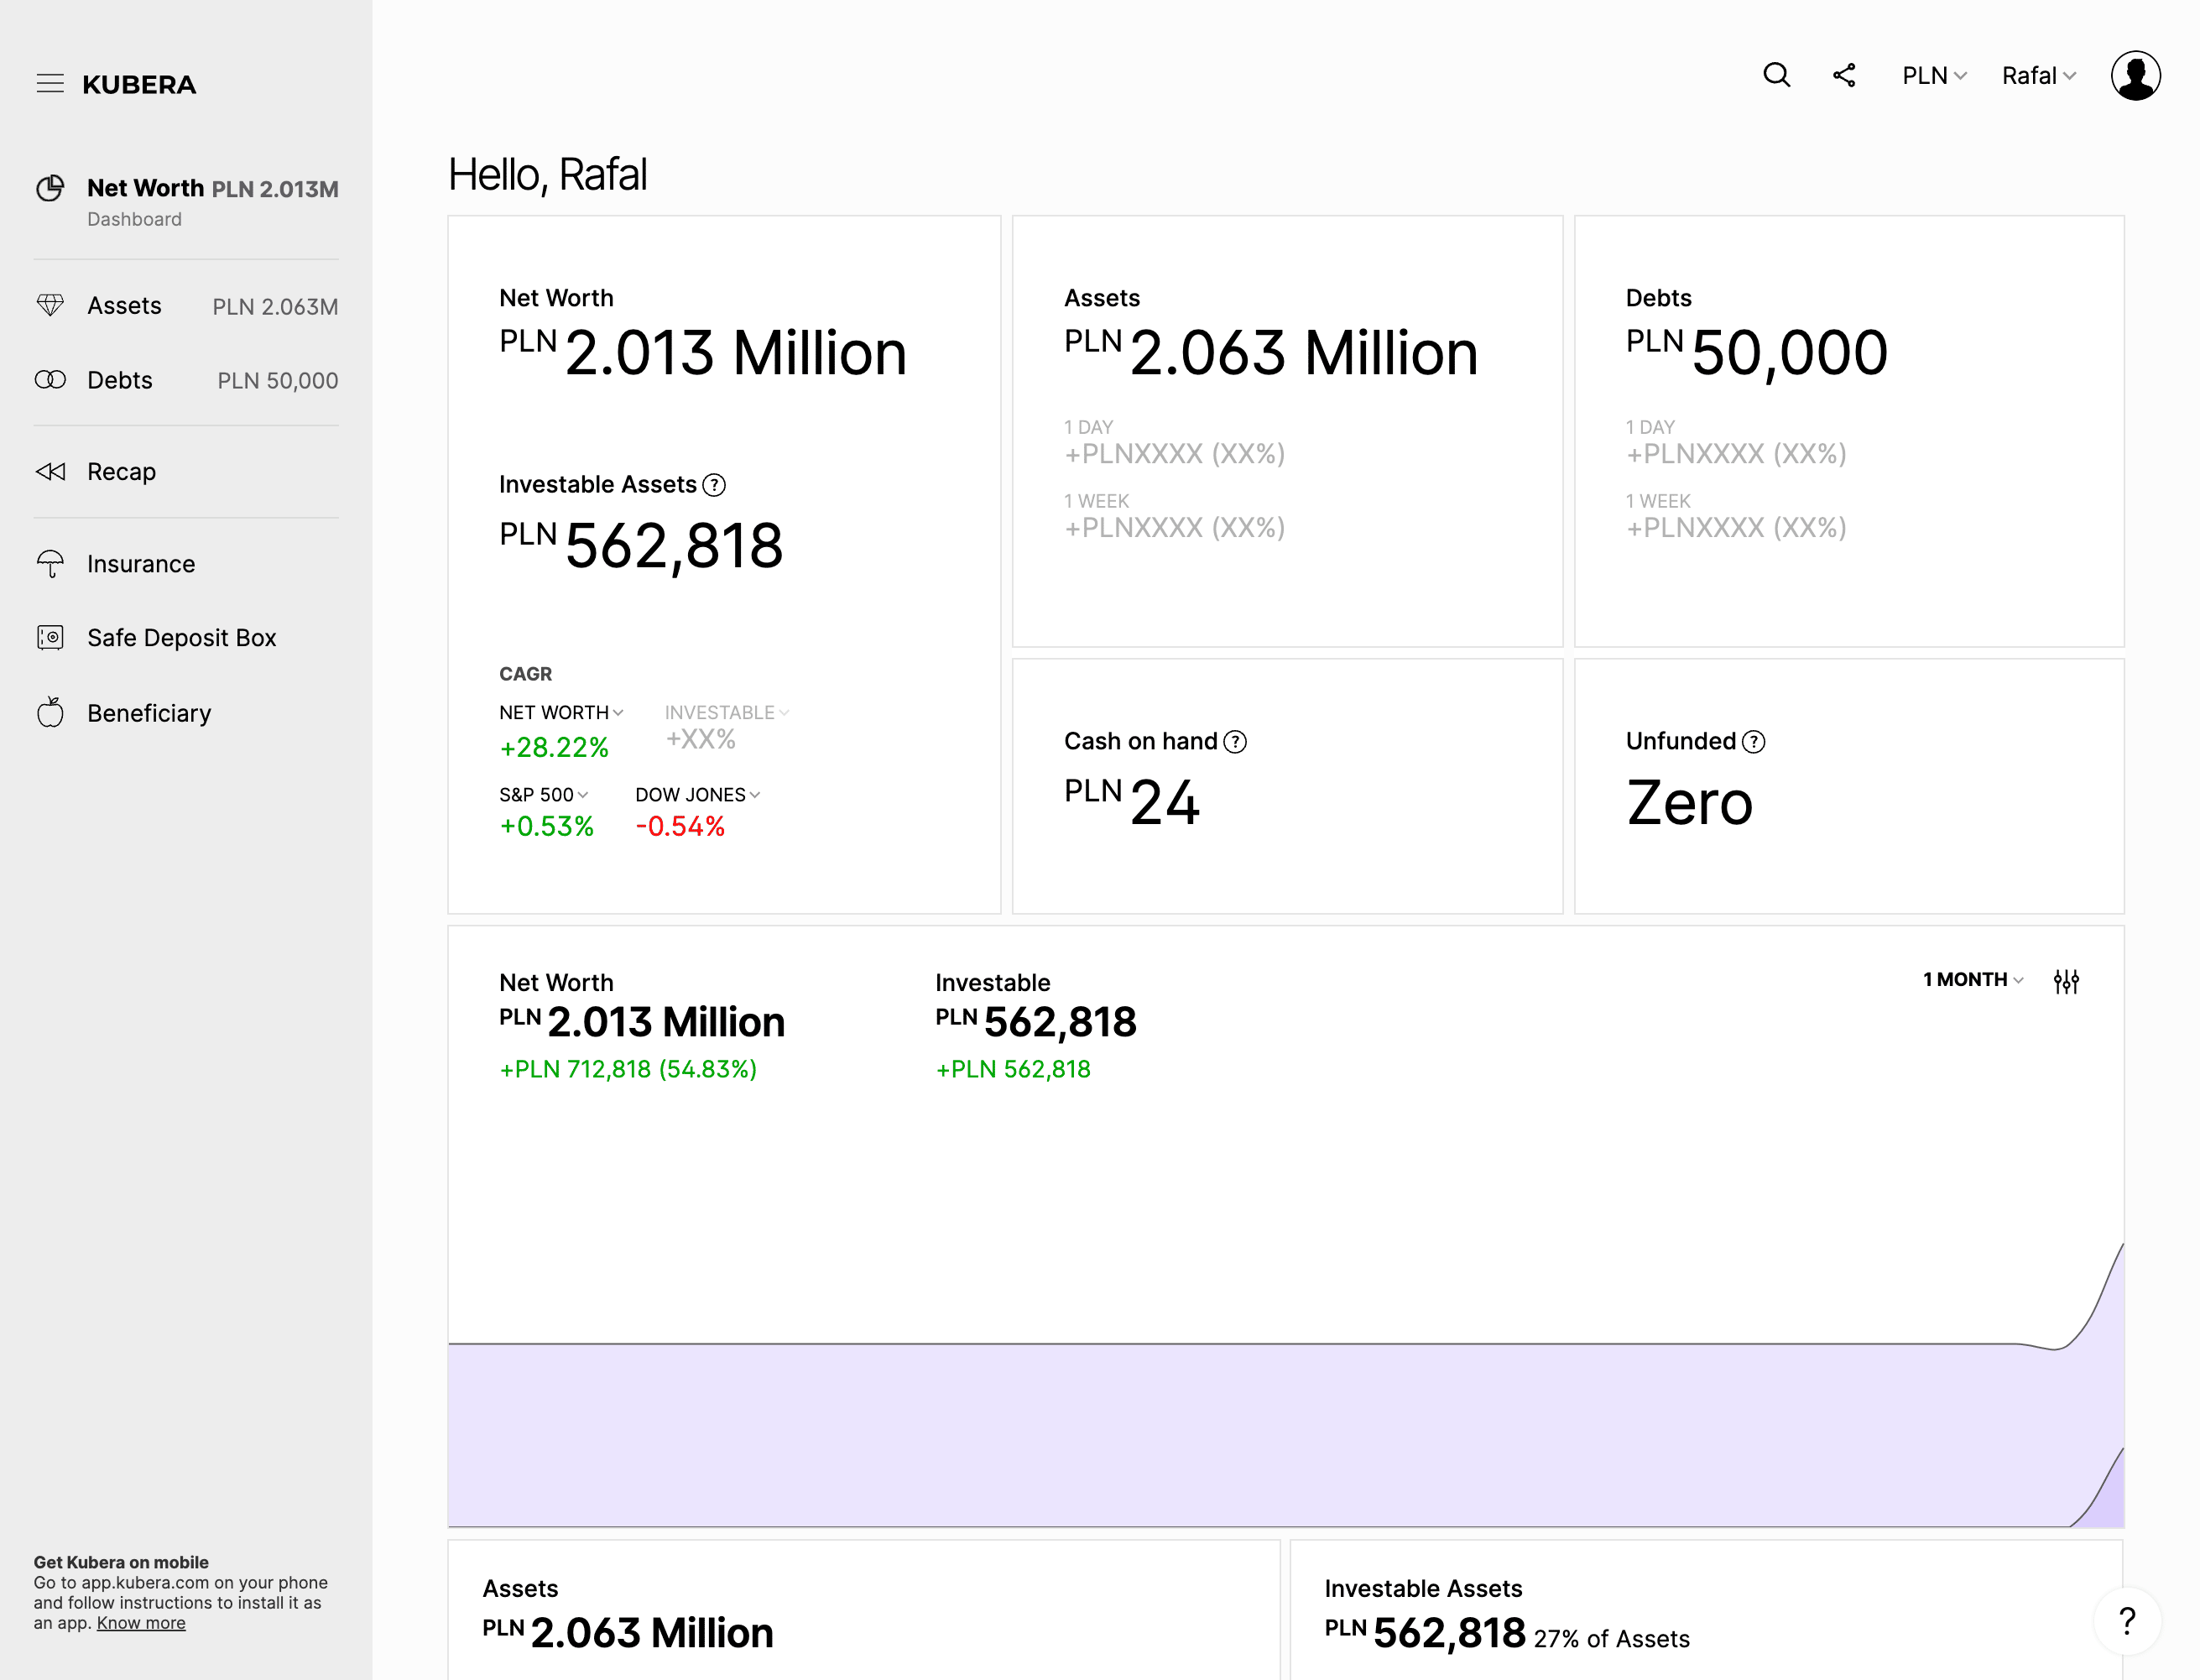 Kubera net worth tracker dashboard
Here's how it scores on the checklist:
- ⭐ User Interface: Kubera's spreadsheet-like interface is clean, modern and built for fast data entry - it never overwhelms you with numbers. The web app is the primary interface, with a mobile version installed as a Progressive Web App.
- ❌ Historical Transactions Support: Kubera tracks current balances, not a transaction ledger. You can optionally record cash flows per asset to get an IRR, but there's no full buy/sell history.
- ✅ Stock Market Tracking: Global stocks, ETFs, bonds and funds are supported, along with crypto via exchange and wallet connections. Market prices are end-of-day.
- 🤏 Tracking Other Wealth Components: Kubera covers a wide range - real estate (Zillow valuations), vehicles, private equity (with direct Carta integration) and illiquid assets via its AI Appraiser - but most are tracked as a value, not a full asset with transactions.
- ✅ Multiple Account Tracking: Assets can be split into account-like sheets and sections. Nested structures for trusts, LLCs and family entities require the $2,500/year Black plan.
- ✅ Account Organisation: Assets are organised into sheets and sections with predefined geography, sector and market-cap buckets. Those taxonomies can't be edited or extended, and there's no custom tagging.
- ✅ Multi-Currency Support: You can view your portfolio in one of a short list of currencies (plus Bitcoin) and enter assets in any currency. There's no separation of FX impact from capital return.
- ✅ User-Friendly Performance Reports: Net-worth trend charts, allocation pie charts and a Sankey cashflow diagram, with IRR that accounts for cashflow timing. It's polished, but limited by the underlying balance-only data.
- ✅ Benchmarks Support: Compare against a short, fixed list of market indexes, plus "Club Benchmarks" that compare your allocation against an anonymised aggregate of similar Kubera users.
- ❌ Tax Handling: You can enter a cost basis and tax rate per asset for a rough estimate, but there's no tax-year segmentation, no country-specific rules and no tax reports.
- 🤏 Importing Transactions: Kubera's AI Import reads PDFs, CSVs and screenshots, and balances sync automatically through nine third-party aggregators (Plaid, Yodlee, MX and others). It's hands-off, but automatic sync only captures balances - and routes your account access through a third party.
- ⭐ Minimal Maintenance Required: If your institutions are supported and you're comfortable with aggregator connections, balances update on their own - you just check in occasionally.
- ❌ Privacy and Data Encryption: Your data sits on Kubera's servers and isn't end-to-end encrypted, so it's reachable by staff with access or in a breach. Automatic sync relies on third-party aggregators. End-to-end encryption applies only to uploaded documents.
- ✅ Portfolio Diversification Reports: High-level allocation charts by asset class, sector, region and market cap. There's no look-through into ETF holdings and no risk metrics.
- ❌ Technical Chart Indicators: Not available - Kubera has no individual-asset price charts.
- ❌ Stock Fundamentals: Not available.
- ❌ Watchlists & Price Alerts: Not available.
- 🤏 Pricing: Essentials is $250/year and there's no free tier; the Black plan, for nested entity structures, is $2,500/year. A 14-day free trial is available, with no upfront fee.
Portfolio Performance - best free, open-source tracker
Portfolio Performance is best for hands-on, technically-minded investors who want complete control and total privacy at no cost. It's a free, open-source desktop app - started in 2012, maintained by a single developer with a large European community - that calculates true time-weighted return and IRR across multiple accounts, with every byte of data stored locally on your machine. The trade-offs are a dated, steep-learning-curve interface and entirely manual data entry: there's no automatic broker sync and you supply your own price data.
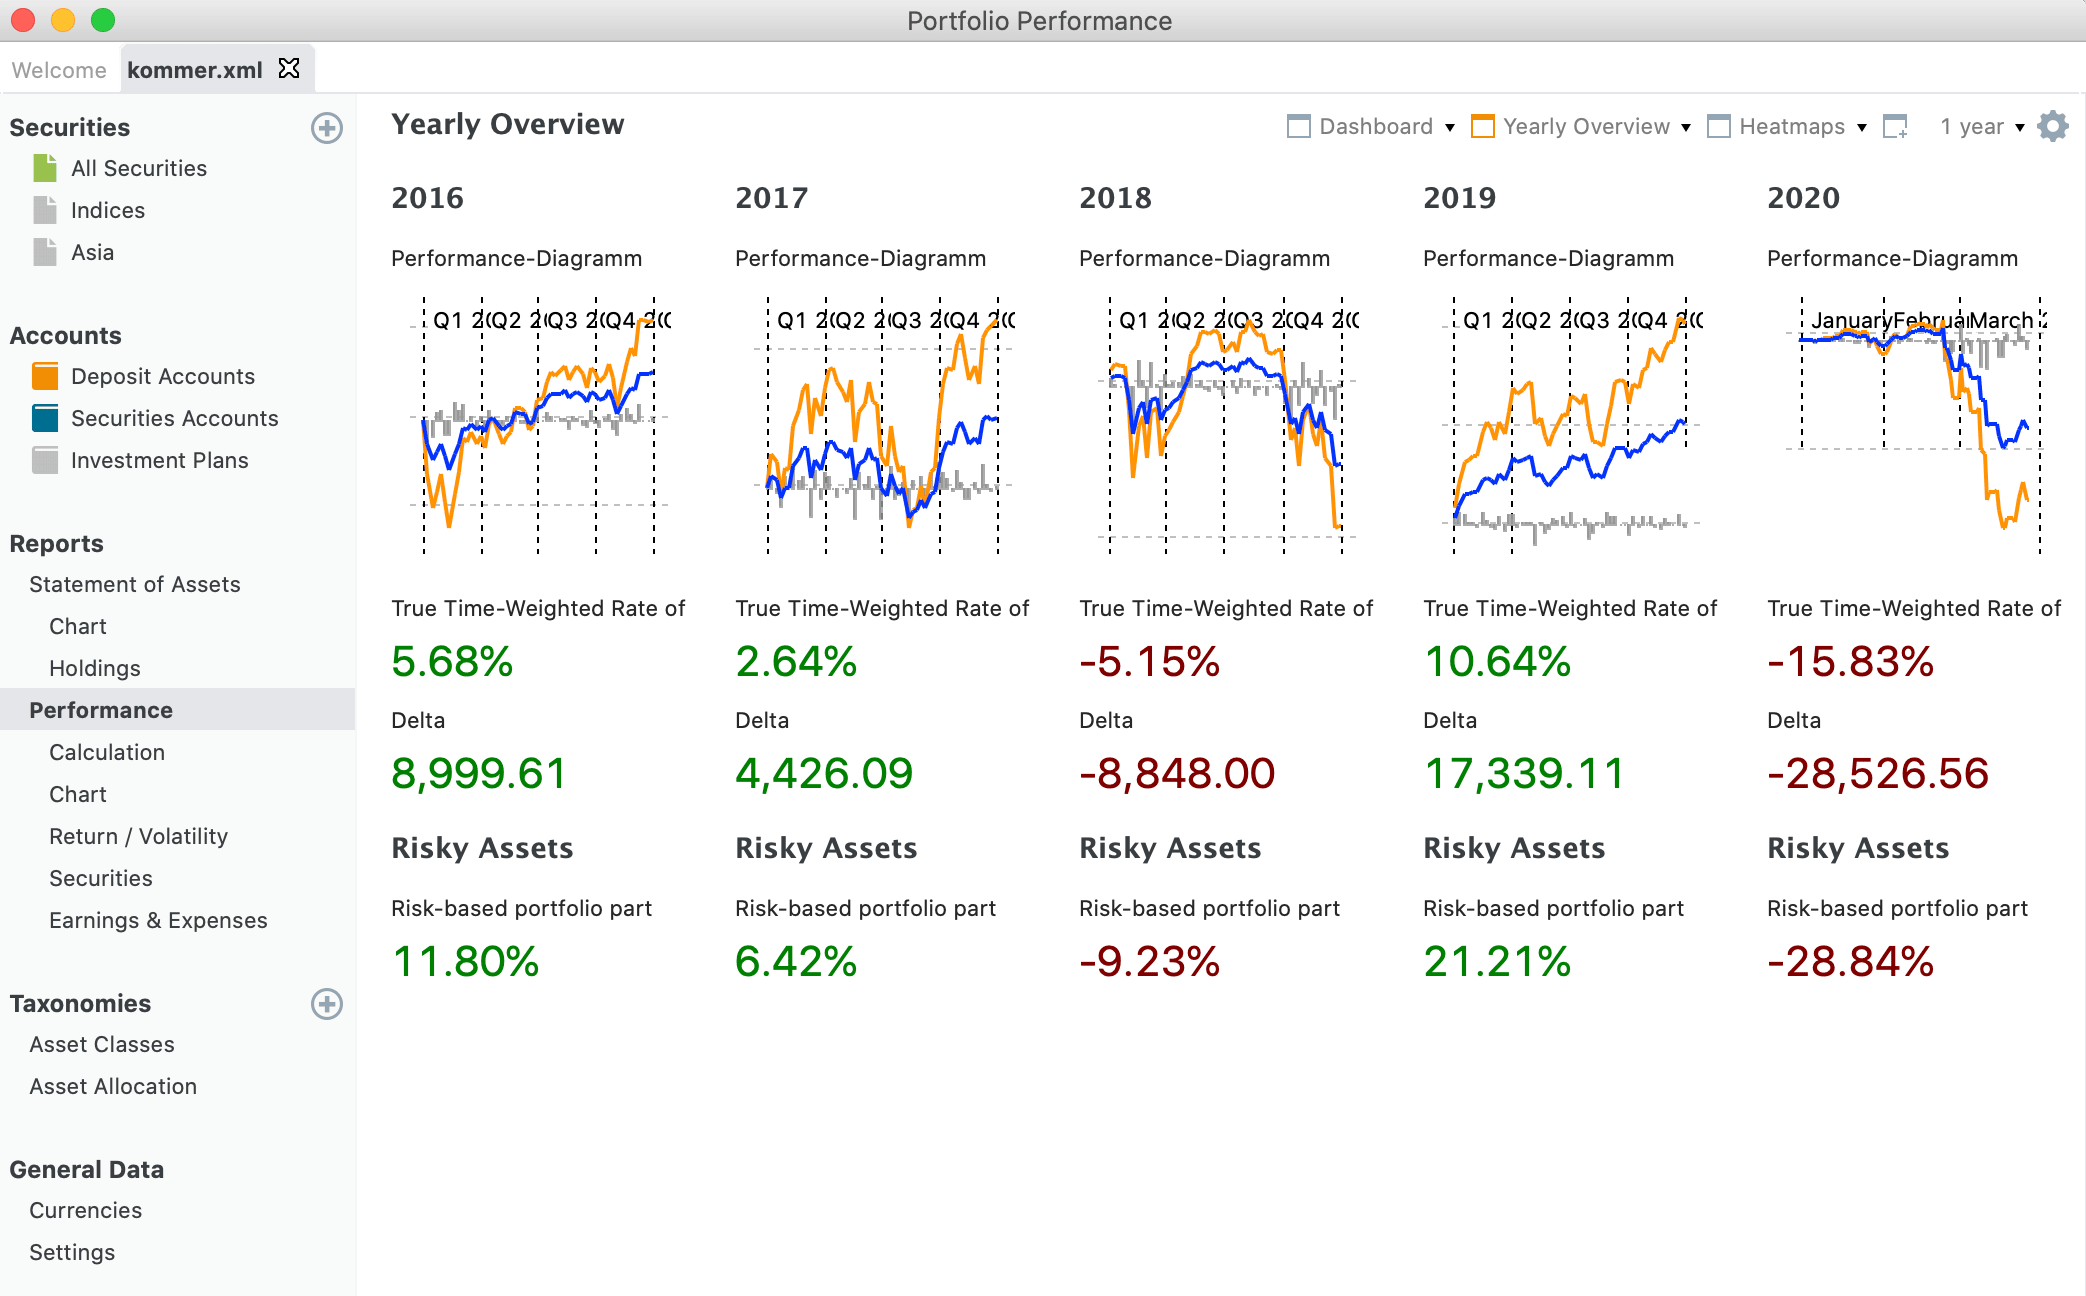 Portfolio Performance open-source desktop tracker
Here's how it scores on the checklist:
- 🤏 User Interface: The desktop interface is functional but dated, with high information density. It's built for power users who want to control every number, and the learning curve is steep - most guidance lives in the wiki and community forum.
- ✅ Historical Transactions Support: Full transaction-level history from day one - buys, sells, dividends, interest, taxes, fees, transfers and splits - with no depth limit.
- 🤏 Stock Market Tracking: Global stocks, ETFs and crypto are supported with dividends and splits, but you supply the price data yourself from configurable sources like Yahoo Finance or AlphaVantage. There's no automatic broker sync.
- 🤏 Tracking Other Wealth Components: Real estate, private equity and other alternatives aren't dedicated asset types - you model them as custom securities with manually entered prices.
- ✅ Multiple Account Tracking: Unlimited securities and cash accounts within a portfolio file, and you can open multiple files side by side.
- ✅ Account Organisation: Organisation is handled through user-defined, nestable taxonomies and saved filters rather than per-asset tags - flexible, but it takes setup.
- ✅ Multi-Currency Support: Strong multi-currency handling: every security and cash account has its own currency, ECB reference rates drive conversions, and capital gains and currency gains are reported separately.
- 🤏 User-Friendly Performance Reports: Reporting is deep - true time-weighted return and IRR over flexible periods, with dashboards built from 48 widgets - but it's complex, and getting useful views out takes patience.
- ✅ Benchmarks Support: Any security in your file can be plotted as a benchmark, and several can be shown at once. There's no blended composite-benchmark builder.
- ✅ Tax Handling: Cost basis can be tracked with FIFO or moving-average methods, and taxes and fees are recorded per transaction. There's no country-specific tax-return generation.
- ✅ Importing Transactions: A capable CSV import wizard with column mapping and a review step, plus PDF statement parsers for 90+ German and European brokers.
- ❌ Minimal Maintenance Required: As with many open-source projects, expect to read guides and tinker. All data entry and imports are manual.
- ⭐ Privacy and Data Encryption: Best-in-class privacy: all data stays in local files on your device, with nothing sent to any server. Files can be password-protected with AES-256 encryption, and there are no ads or trackers.
- ✅ Portfolio Diversification Reports: Taxonomy-based diversification with donut charts, treemaps and rebalancing tables. A security can be split fractionally across categories, though ETF look-through is fully manual.
- ❌ Technical Chart Indicators: Not available - only basic price charts with transaction-event overlays and a FIFO purchase-price line, not classical indicators like RSI or MACD.
- ❌ Stock Fundamentals: No built-in fundamentals view, though external data providers can be configured to pull some data points.
- ❌ Watchlists & Price Alerts: No price alerts or notifications. A security can sit in a file without a transaction to act as an informal watchlist.
- ⭐ Pricing: The desktop app is completely free and open-source. The optional companion mobile app is freemium - a free viewer plus a paid subscription that unlocks all dashboards.
Stock Rover - best for US stock pickers
Stock Rover is best for US-focused stock pickers who choose holdings on fundamentals, screeners and technical charts. Founded in 2008, it pairs 700+ fundamental metrics, ranked and equation screeners and proprietary stock ratings with portfolio analytics, real-time price alerts and watchlists - the closest tool here to StockMarketEye's research-and-charts heritage. The limits are scope: it covers only US- and Canadian-listed securities, has no crypto, real estate or liabilities, and reports in USD only. (Long-time CEO Howard Reisman stepped down in late 2025.)
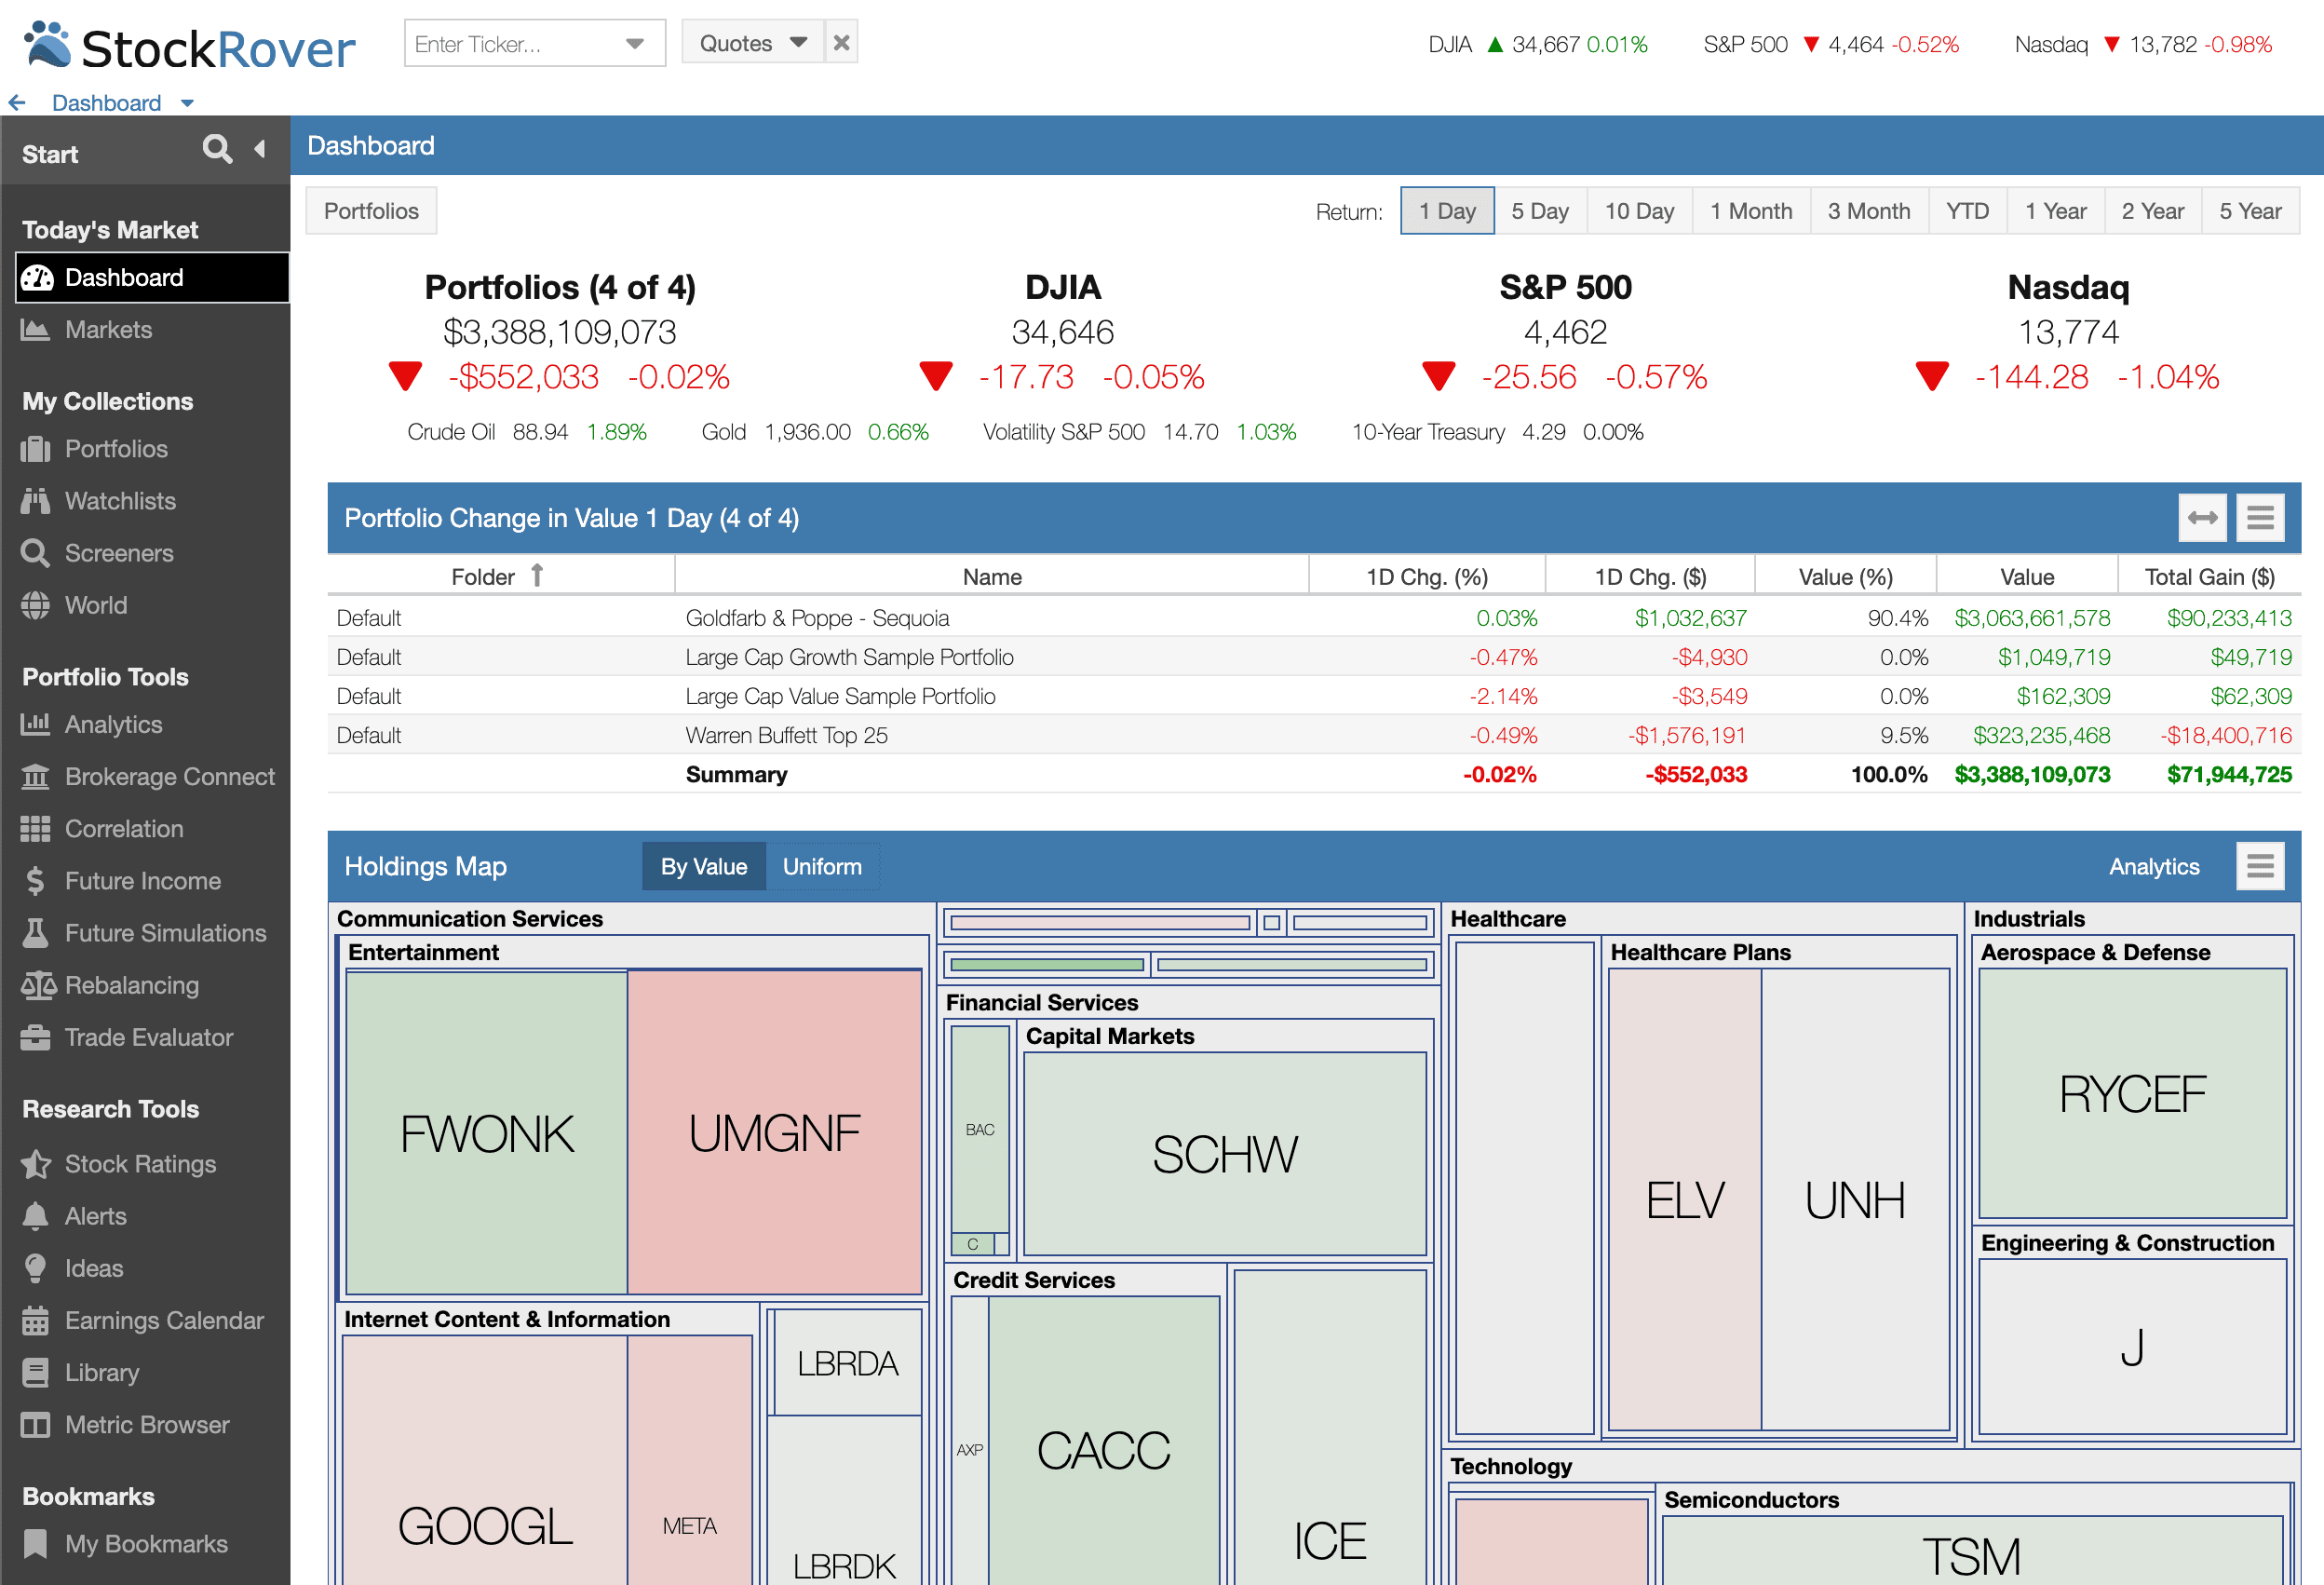 Stock Rover stock research and analytics platform
Here's how it scores on the checklist:
- 🤏 User Interface: A spreadsheet-and-panel interface built around a heavily customisable dynamic table. It's professional but data-dense and visually dated - reviews consistently call it "powerful but intimidating" for beginners. Dark mode is in beta.
- 🤏 Historical Transactions Support: You can enter or import full transaction history, but brokerage-linked portfolios only see current positions and infer approximate buys and sells going forward. Specific tax-lot details aren't preserved.
- 🤏 Stock Market Tracking: Deep, near-real-time tracking - but only for US- and Canadian-listed stocks, ETFs and mutual funds. No other exchanges, no crypto, no forex.
- ❌ Tracking Other Wealth Components: Bonds, real estate, commodities and the like can only be entered as generic "Other Assets" with a value - no class-specific functionality.
- 🤏 Multiple Account Tracking: There's no multi-account model within a portfolio, but you can keep multiple portfolios (10/25/60 depending on plan) in a foldered navigation tree.
- 🤏 Account Organisation: Organisation comes from grouping investments into portfolios and folders, plus flat tags and saved Views. Sector and industry classifications come from Morningstar and can't be edited globally.
- ❌ Multi-Currency Support: USD is the only true reporting base. Prices show in each security's native currency with USD conversion columns, but there's no base-currency switch and no FX-vs-capital separation.
- ✅ User-Friendly Performance Reports: Portfolio Analytics covers TWR, IRR, Sharpe ratio, beta, volatility and benchmark correlation, plus a Trade Evaluator that grades each completed trade. The data is rich, but you need to be comfortable navigating it.
- ✅ Benchmarks Support: Any single ticker, ETF or index can be set as a benchmark. There's no support for blended composite benchmarks.
- ❌ Tax Handling: Minimal. Stock Rover tracks a basic cost basis but has no FIFO/LIFO/specific-lot selection, no country-specific tax reports and no tax-loss harvesting.
- 🤏 Importing Transactions: Transactions import from CSV, Excel or text files with a simple column-mapping step, but mappings can't be saved as reusable templates and there's no support for custom data logic.
- ✅ Minimal Maintenance Required: The app itself doesn't demand much upkeep, though as a research tool how much work it needs depends on your investing style.
- 🤏 Privacy and Data Encryption: Standard server-side security. Brokerage credentials are held by the aggregator Yodlee rather than Stock Rover, but there's no client-side encryption, no documented two-factor authentication and no SOC 2 certification advertised.
- ✅ Portfolio Diversification Reports: Drillable allocation pie charts (asset class to sector to industry to stock), a holdings heatmap, and ETF profile pages that expose underlying holdings.
- ⭐ Technical Chart Indicators: A full set - SMA, EMA, RSI, MACD, Bollinger Bands and Stochastic - plus the ability to chart hundreds of fundamental metrics against price.
- ⭐ Stock Fundamentals: Stock Rover's flagship strength: 700+ financial metrics on its top tier, ranked and equation screeners, proprietary stock ratings, scores like the Piotroski F-Score, and eight-page research reports for 7,000+ stocks.
- ⭐ Watchlists & Price Alerts: Watchlists are first-class objects (up to 60, with hundreds of tickers each), and real-time alerts can fire by email or text on price, percentage moves, volume, metric levels or upcoming earnings.
- ✅ Pricing: A permanent free plan plus three paid tiers - roughly $80 to $280 per year - and a 14-day trial with no card required. In-depth Research Reports are a separate add-on.
Sharesight - best for automated dividend and tax reporting in supported countries
Sharesight is best for investors with publicly-listed portfolios who want automated dividend tracking and ready-made tax reports for Australia, New Zealand, Canada, the UK or the US. Founded in 2007, it handles corporate actions automatically and, through 2025-26, expanded into bonds, precious metals, ETF look-through and predictive income forecasting. The weak spots are flexibility: no liabilities, one fixed base currency per portfolio, no end-to-end encryption, and tax reports that only shine in its five supported countries.
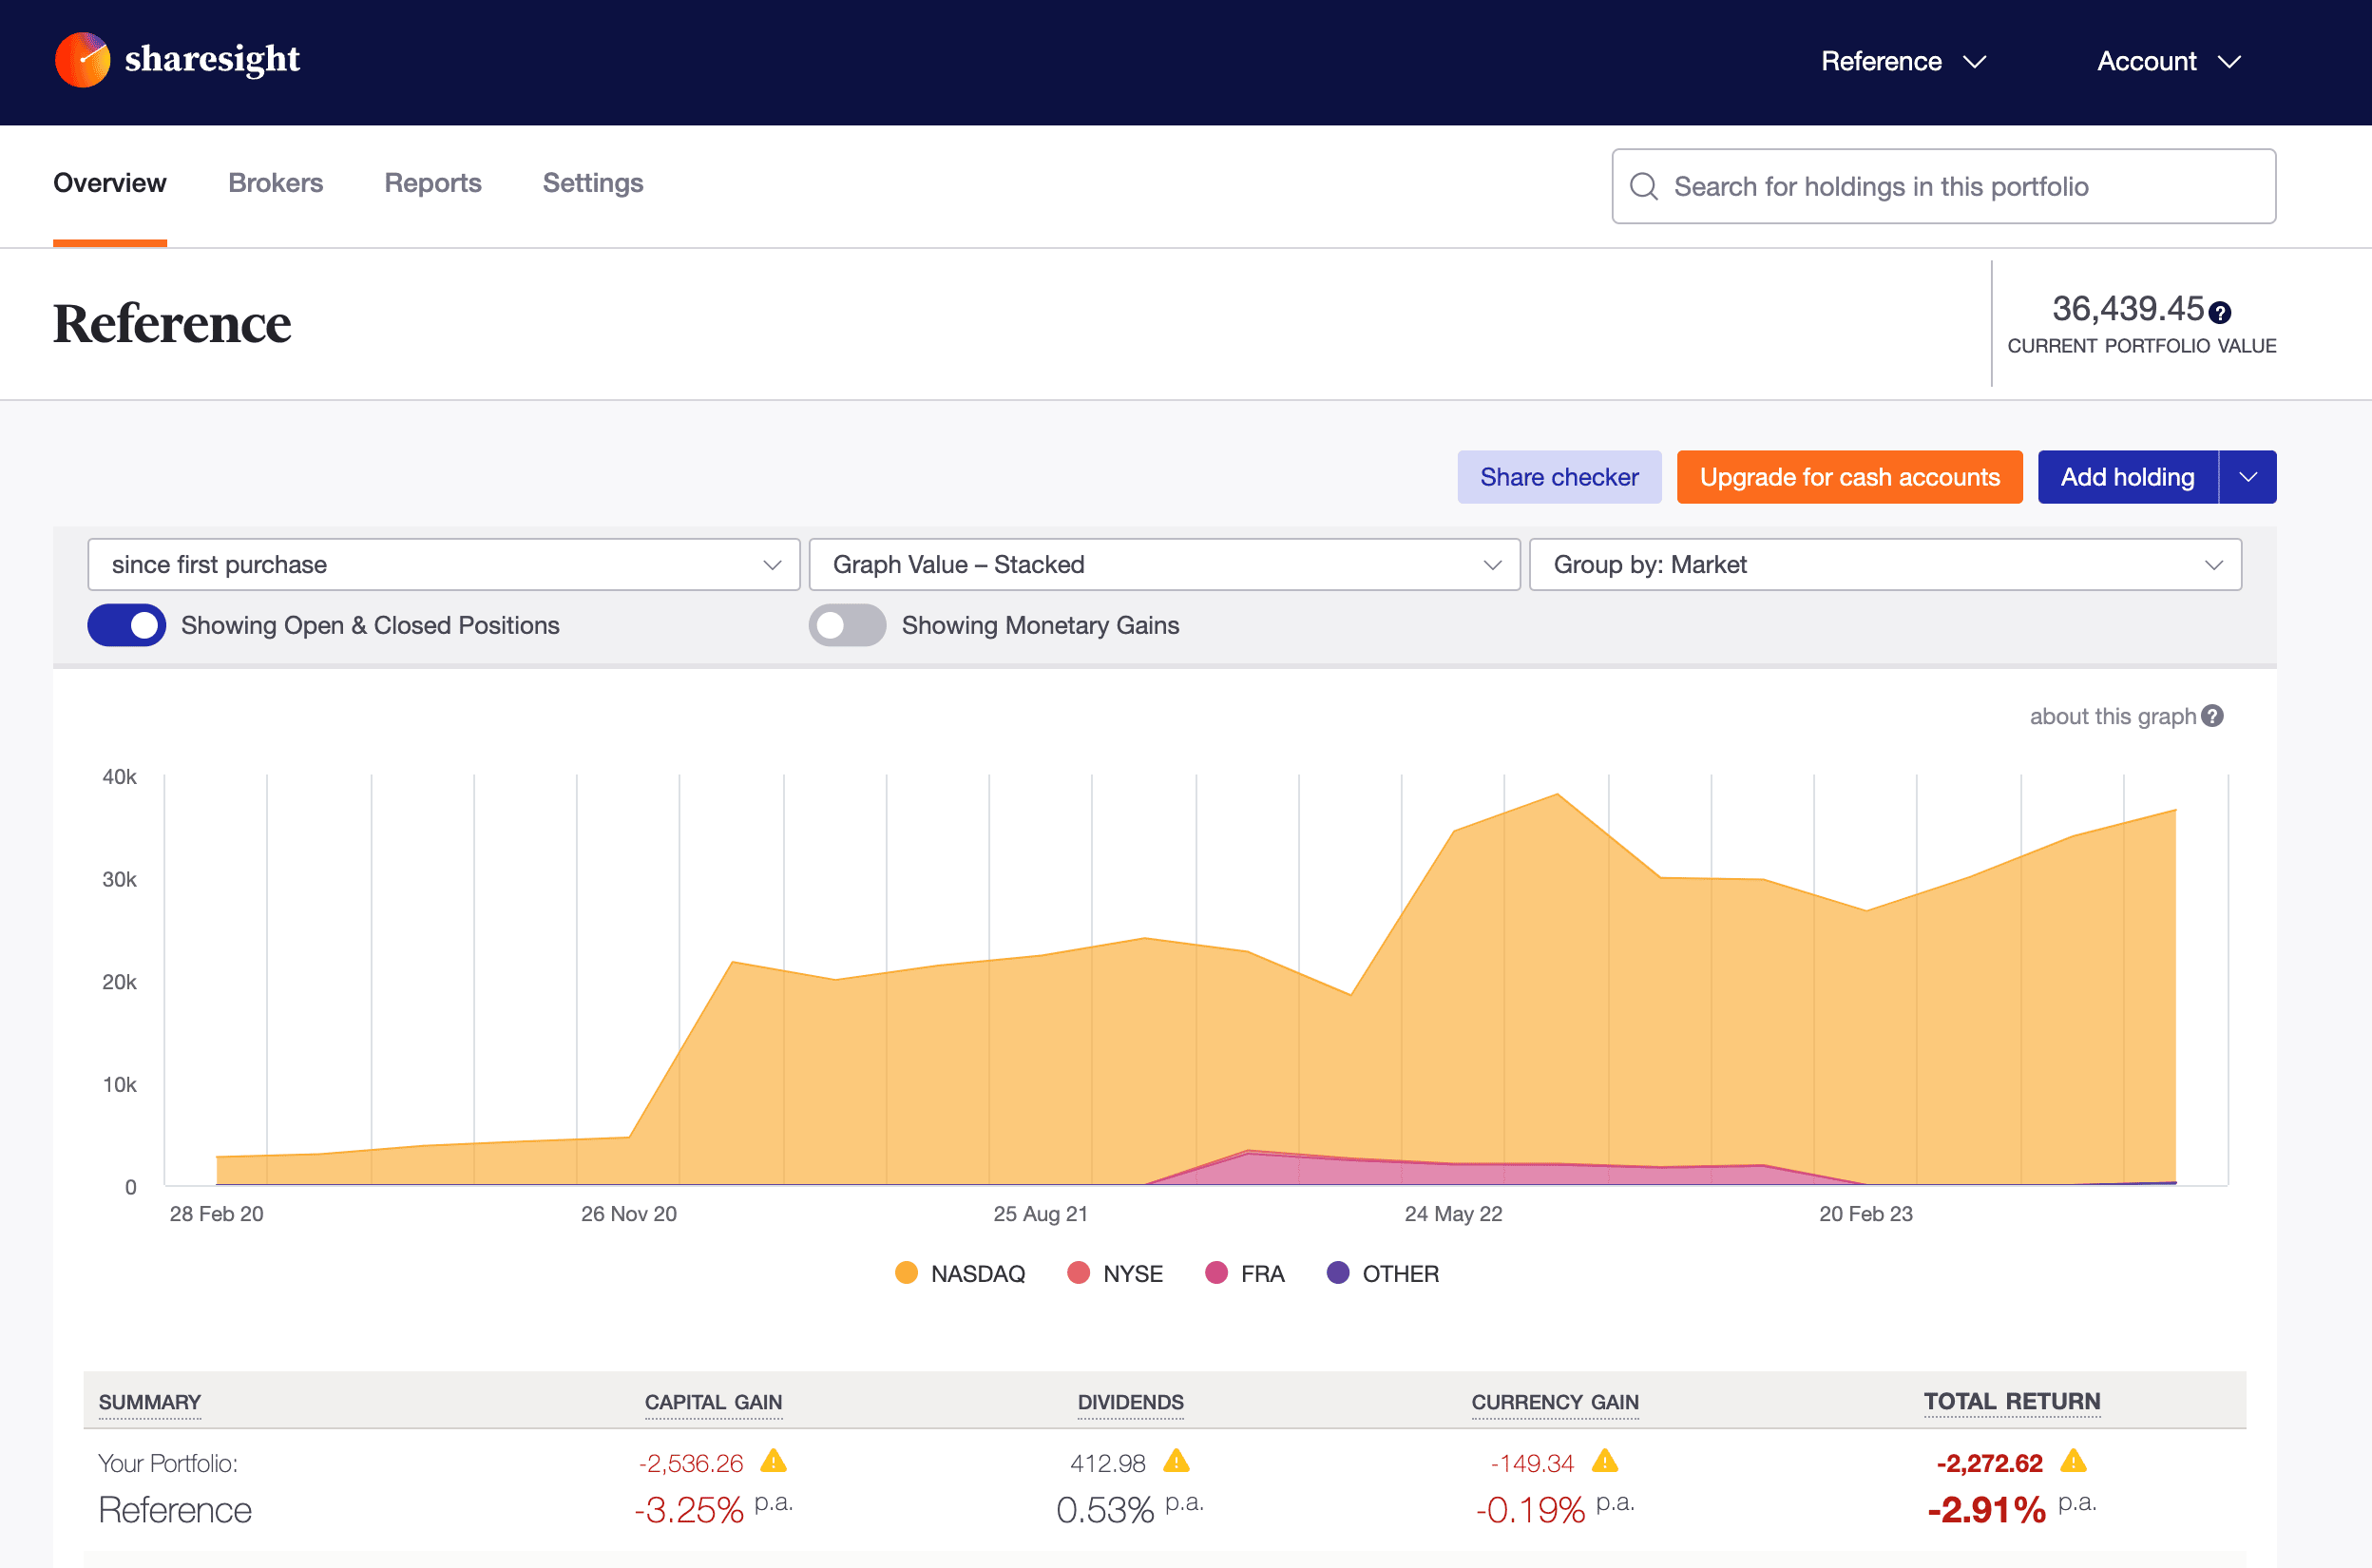 Sharesight portfolio and tax reporting dashboard
Here's how it scores on the checklist:
- 🤏 User Interface: The web interface is functional and data-rich but visually dated, and large portfolios can feel slow. Rebuilt native iOS and Android apps (2025) are more modern but limited in scope, and a redesigned "Investments" tab rolled out in early 2026.
- ✅ Historical Transactions Support: Full historical transactions can be entered manually or via CSV, letting you reconstruct performance from inception - or you can start from current holdings plus an opening balance.
- ⭐ Stock Market Tracking: Sharesight's founding strength: automatic dividend tracking and corporate-action processing for supported markets, so price, income and split data stay current with little manual work.
- ✅ Tracking Other Wealth Components: Listed securities are the focus, but Sharesight has added a Real Estate custom asset type, precious metals and fixed income (20,000+ LSE bonds, plus US bonds). Real estate and private equity are still tracked manually.
- 🤏 Multiple Account Tracking: There's no account model - you separate holdings into portfolios (4-10 depending on plan) or custom groups instead.
- ✅ Account Organisation: Holdings can be grouped by standard market classifications (industry, sector, country) or your own custom groupings.
- 🤏 Multi-Currency Support: Each portfolio has a single base currency that's fixed when you create it and can't be changed - though transactions can be logged in other currencies, and capital and currency gains are reported separately.
- ✅ User-Friendly Performance Reports: A solid set of predefined reports - Total Return, Capital Gains, a 2025 Drawdown Risk report and an Exposure report - though the reports themselves can't be heavily customised or built from scratch.
- ✅ Benchmarks Support: Portfolios or individual holdings can be benchmarked against any instrument in Sharesight's database. There's no blended composite-benchmark builder.
- ✅ Tax Handling: Sharesight produces excellent country-specific tax reports for Australia, New Zealand, Canada, the UK and the US - including Australian franking credits and US Form 8949 data. Outside those five countries it works as a generic capital-gains report, and the rules can't be customised.
- ✅ Importing Transactions: CSV uploads with templates, manual entry, and trade-confirmation email forwarding for ~240 supported brokers. Column mappings can't be saved for reuse, and wrong imports can't be quickly undone.
- ✅ Minimal Maintenance Required: Depends on your brokers - many update automatically via email or API, though a portfolio with many custom assets needs more manual work.
- ❌ Privacy and Data Encryption: Data sits on Sharesight's servers and isn't end-to-end encrypted, and as of 2026 the app loads several third-party advertising and analytics trackers (Meta Pixel, LinkedIn, Reddit Ads and others). There's also no one-click export of all your data. Sharesight does hold SOC 2 Type 2 certification (May 2025), which covers organisational security processes - not end-user encryption.
- ⭐ Portfolio Diversification Reports: Sharesight's Exposure report looks through your ETFs to their underlying holdings across global and European markets - the best ETF-overlap analysis in this comparison - alongside standard country, sector and industry breakdowns.
- ❌ Technical Chart Indicators: Not available - only basic price charts.
- 🤏 Stock Fundamentals: Basic fundamentals like P/E and EPS are shown, but only for companies listed on the Australian (ASX) and New Zealand (NZX) exchanges.
- 🤏 Watchlists & Price Alerts: Watchlists and price alerts are available, but only through the mobile apps.
- 🤏 Pricing: A free plan capped at 10 holdings, then paid tiers from roughly $84 to $279 per year (Starter, Standard and Premium). The free plan is too restrictive for real evaluation, though a shared demo portfolio lets you see the advanced reports first.
Frequently asked questions
Yes. StockMarketEye shut down in September 2023 and is no longer sold, updated or supported. Existing installations may still open, but market data and cloud features have stopped working, so it can't be relied on as a current portfolio tracker.
If you still have a working StockMarketEye installation, export your accounts and transactions to CSV from within the app - do this as soon as possible, since an unsupported app can stop working at any time. If you've already lost access, you'll need to rebuild your history from broker statements instead.
For US stock pickers, Stock Rover is the closest match - it shares StockMarketEye's focus on screeners, fundamentals, watchlists and technical charts. For investors who want to track a whole multi-asset portfolio rather than just stocks, Capitally is the broadest replacement, and Portfolio Performance is the closest free, desktop-based option.
Capitally and Portfolio Performance handle multi-currency portfolios best: both let every holding keep its own currency and report capital and currency returns separately. Stock Rover reports in USD only, and Sharesight locks each portfolio to a single base currency, so both are harder to use for genuinely international portfolios.
Capitally has a built-in import template for StockMarketEye exports - the step-by-step guide to switching from StockMarketEye to Capitally walks through it. For other tools, export your StockMarketEye data to CSV and use the destination app's import wizard, mapping columns to transactions; expect some manual cleanup of historical prices and corporate actions.
Final words
There's no single best StockMarketEye alternative - the right pick depends on what you're tracking and what you care about. For US stock pickers who want screeners, fundamentals and technical charts, Stock Rover is the closest successor. For a free, fully private, desktop-based tracker, Portfolio Performance is hard to beat, if you're willing to climb its learning curve. For the simplest possible whole-net-worth view with automatic balance syncing, Kubera does the job - provided you don't need a transaction history. For investors with publicly-listed portfolios who want automated dividend tracking and ready-made tax reports in Australia, New Zealand, Canada, the UK or the US, Sharesight is the specialist. And for privacy-conscious investors with complex, multi-currency portfolios spanning stocks, options, private equity, property and liabilities, Capitally offers the broadest coverage behind on-device end-to-end encryption - at the cost of a more hands-on, manual-import workflow.
Whichever you choose, the StockMarketEye shutdown is a good prompt to get your data into a tool you can rely on for the long run. If Capitally looks like the right fit, the guide to switching from StockMarketEye covers the move step by step. For a broader survey of multi-asset portfolio trackers beyond the StockMarketEye context, see our comparison of portfolio trackers for the DIY investor.