A brokerage statement and a portfolio tracker answer one question well: is the investing strategy working? Real return after fees, taxes and currency moves, allocation drift, benchmark gap. What they cannot answer is the bigger one — what is the household actually worth right now, and what does that mean for the decisions in front of it: affording a sabbatical, lowering equity risk before retirement, deciding whether to pay down a mortgage or invest a bonus.
Most investors track only the slice that sits in their brokerage accounts. According to the St. Louis Fed's analysis of Distributional Financial Accounts data, households between the 50th and 90th wealth percentiles hold roughly a quarter of their wealth in stocks and mutual fund shares; even at the top 1%, that share peaks around 85% (Comparing Household Assets Across the Wealth Distribution, 2024). The remainder — primary residence, rental property, private business stakes, pensions, cash, collectibles, and the debt sitting against them — is the part a portfolio tracker can't see.
This article makes the case for adding a net-worth view alongside portfolio performance: why the broader lens is worth the effort, what gets missed when you skip it, and an honest survey of the real options for doing it well — doing nothing, doing it manually, using a portfolio tracker built for stocks, or using an integrated tool that handles both lenses. The goal is a practical view of what to track and why, not a tool review.
Table of Contents
Net worth or portfolio performance — which should you track?
Both — they answer different questions. Portfolio performance is the strategy lens: is the way money is allocated, rebalanced and reinvested beating a fair benchmark after fees, taxes and currency moves. Net worth is the life-decision lens: what is actually owned net of what is owed, and how that number is trending. The same transactions can feed both views, but the slice each one looks at is different.
Portfolio performance is what a broker's statement and a portfolio tracker compute. It uses time-weighted return to judge a strategy independent of cash-flow timing, money-weighted return to keep the timing in, and metrics like FX attribution to separate the part of a return that came from the asset itself from the part that came from the exchange rate. Net worth is the balance-sheet view: every asset class added together, minus every liability. The two are complementary, not interchangeable, and looking only at the strategy lens tends to overstate how much of the household's wealth the investor is actually steering.
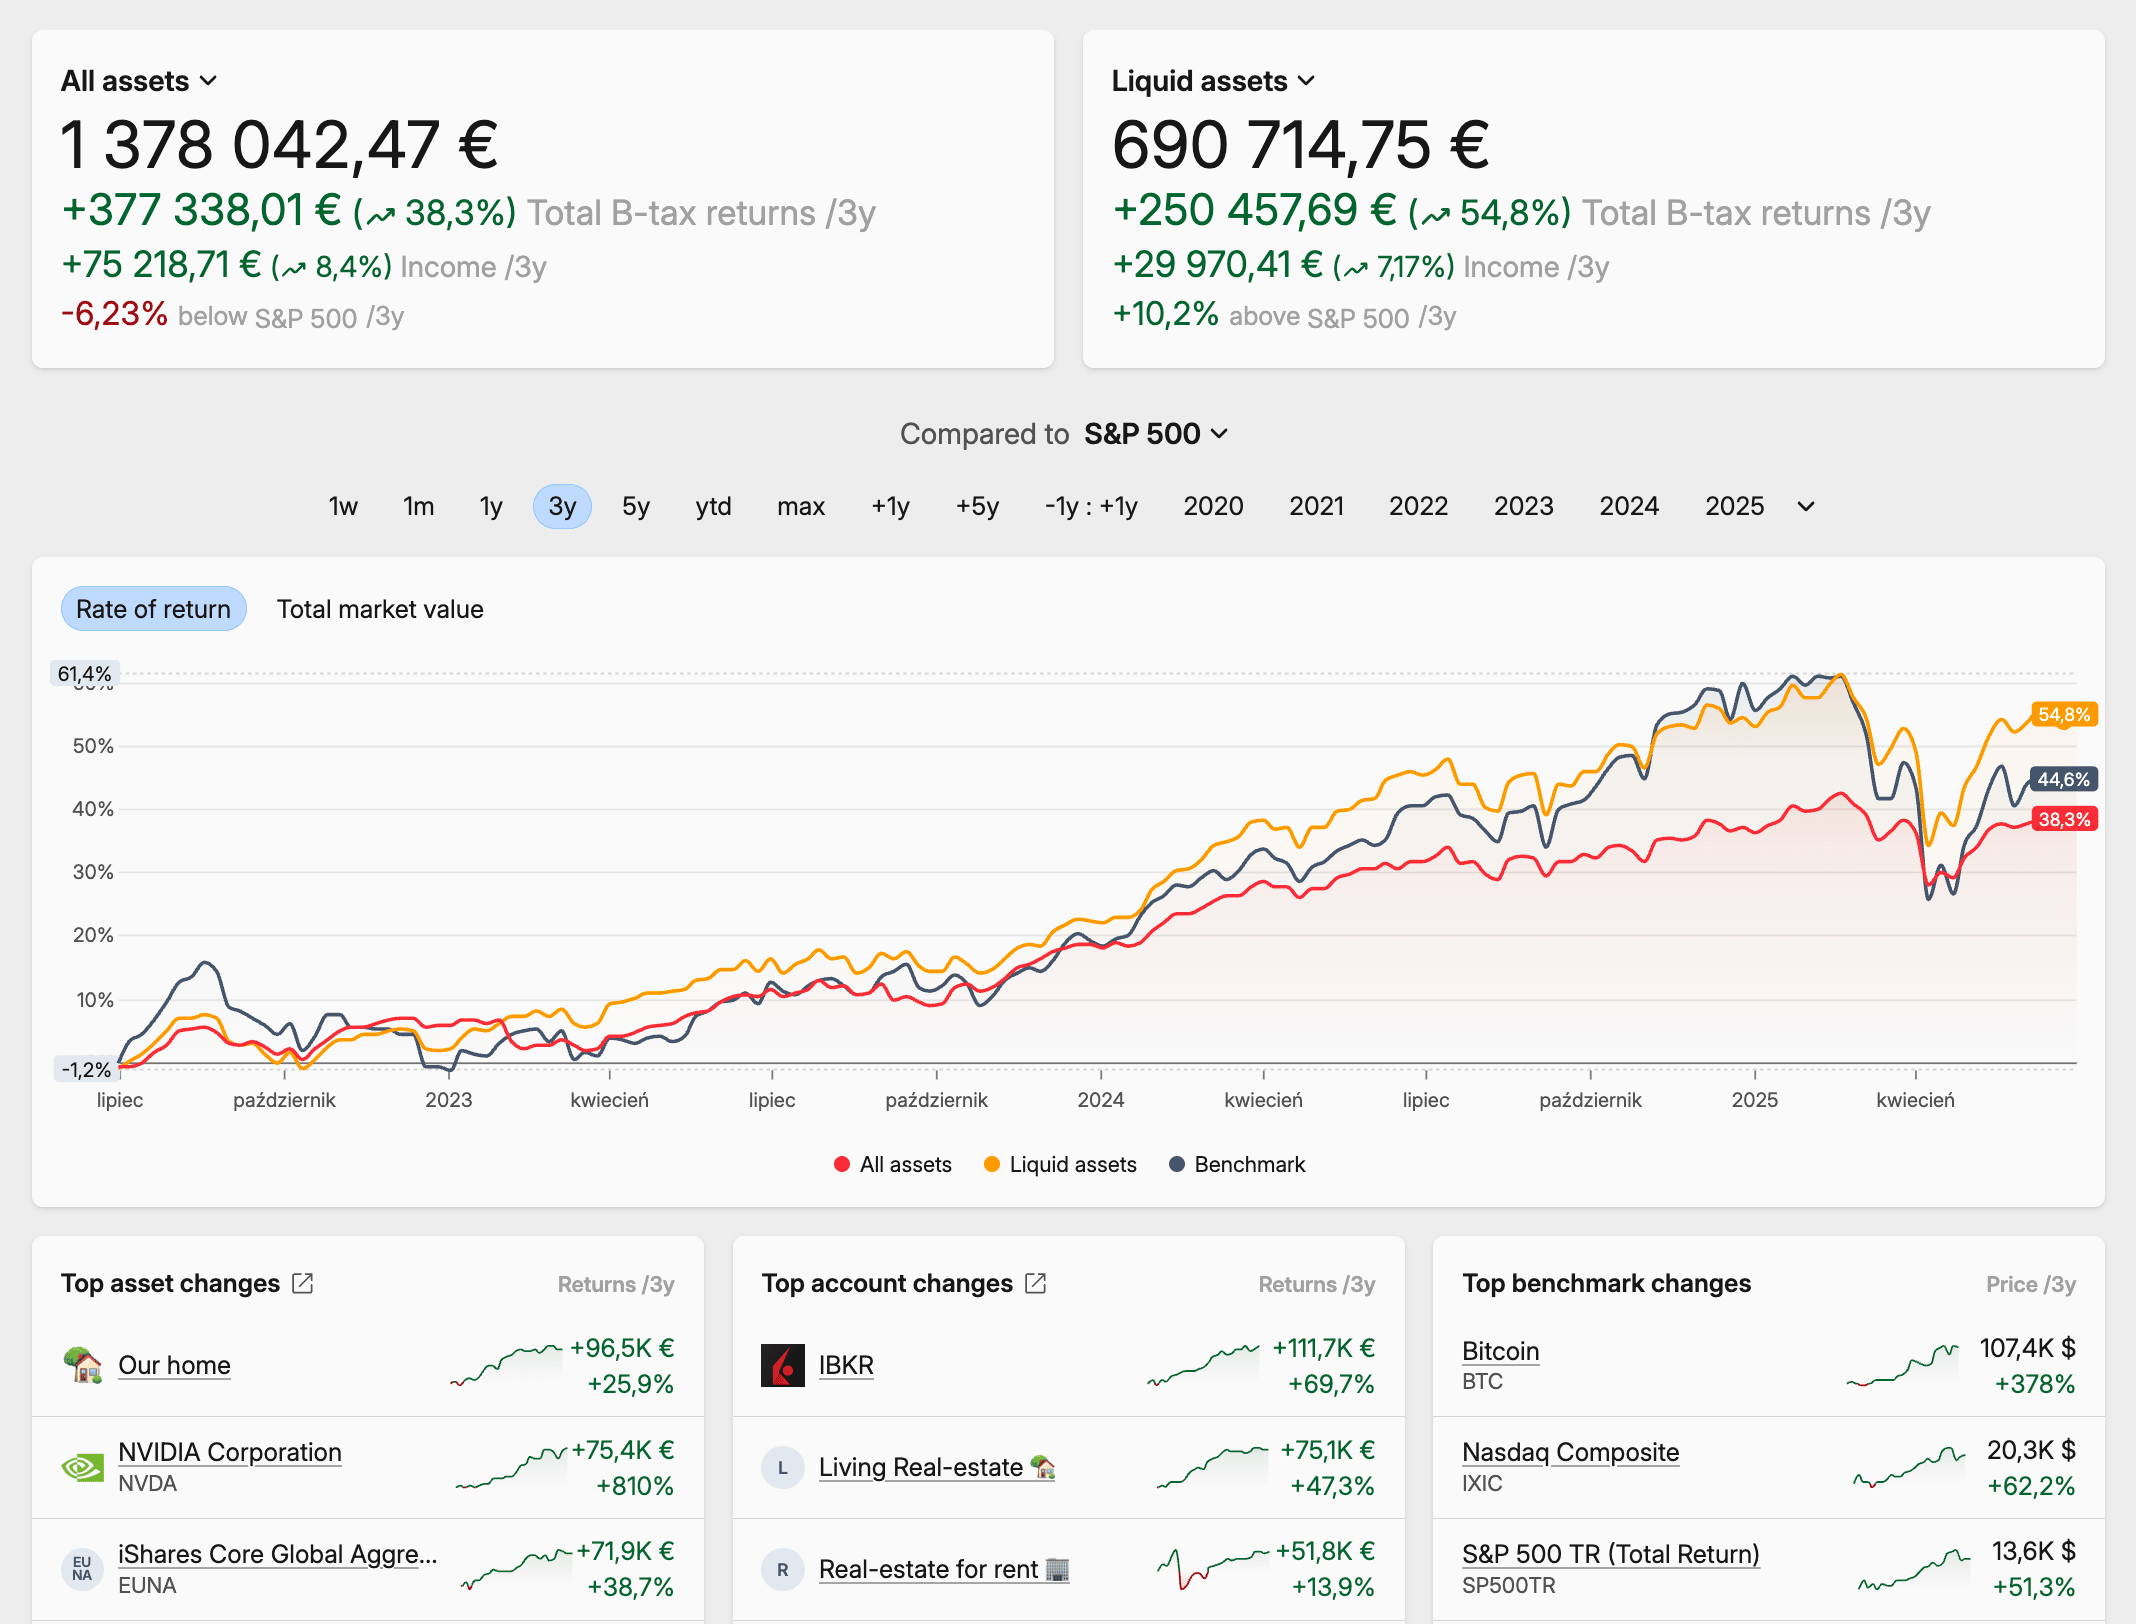 A complete wealth view in Capitally
What a portfolio tracker leaves out
Everything that doesn't sit inside a brokerage account, and everything owed against any of it. For most households that means the primary residence, mortgage and other property debt, rental property and the cash flows attached to it, private business stakes and concentrated employer equity, pensions and other defined-benefit promises, cash reserves outside the brokerage, and any meaningful collectibles. A portfolio tracker built for listed securities models none of this directly, and a tracker built for tax reporting on listed securities usually skips liabilities entirely.
The composition is not a minor detail. The Federal Reserve's Distributional Financial Accounts and Survey of Consumer Finances both show that for the broad middle of the US wealth distribution, the primary residence is the largest single asset on the household balance sheet, with retirement accounts and private business stakes carrying meaningful weight as well. Tracking only the brokerage line in that picture isn't tracking the household's wealth — it's tracking a minority share of it.
Why liabilities belong in the picture
Net worth is assets minus liabilities, and a view that omits the debt overstates what's actually owned, hides leverage, and misjudges risk capacity. A 60/40 portfolio attached to a 70%-LTV mortgage is not a 60/40 risk profile; it's a leveraged one. A margin loan or a HELOC changes the same calculus for the brokerage account itself. Mortgage paydown is also one of the largest "returns" most households earn in a given year, and it's invisible without liability tracking.
Most tools designed for the brokerage account treat liabilities as someone else's problem. Aggregator-based wealth dashboards usually surface a mortgage or loan as a current balance pulled from the lender — useful for the snapshot, less useful for understanding the carrying cost. Listed-securities-focused trackers commonly omit liabilities entirely. The handful of integrated trackers that do treat loans and mortgages as first-class — Capitally is one — model interest accrual and amortization directly, so a paid-down mortgage shows up alongside a dividend rather than as a balance that just gets smaller over time.
What you lose without a net-worth view
Four kinds of decisions consistently get made worse when the view stops at the brokerage account. None is catastrophic on its own; the cost is that they compound over years into a materially worse outcome than the same investor would get with both lenses in place.
Asset allocation that reflects reality
A "60/40 portfolio" can quietly be 15% of the household's real allocation when home equity, an employer pension and a private-equity LP stake sit alongside it. Rebalancing the brokerage account toward a target mix means very little if it's a minority slice. The cost without a net-worth view is real rebalancing decisions made against the wrong denominator — usually nudging the household toward a portfolio risk profile that doesn't match the household's actual risk profile.
Leverage you can actually measure
A portfolio-only view can show a "conservative" allocation while the household carries a 70%-LTV mortgage, an open HELOC, and a margin position against the brokerage account. The combined picture is materially riskier than any single line suggests. Without liabilities in the model, the actual leverage stays invisible — and the investor reaches for less margin or more, not based on real risk capacity but on what happens to be visible at the time of the decision.
Asset location for taxes
Asset allocation decides what's owned. Asset location decides which account each piece sits in: taxable, tax-deferred, tax-free. Putting tax-inefficient holdings (bond interest, REIT distributions) into tax-deferred accounts and tax-efficient ones (broad equity index funds) into taxable accounts is invisible to a portfolio-only view but consistently adds basis points to after-tax outcomes — it's one of the durable findings in Vanguard's Advisor's Alpha research on the value contribution of asset-location work. Without a view that sees all the accounts at once, the optimization can't happen at all.
Income visibility across every source
Dividends from the brokerage account, rental income from a property, interest from a bond ladder or a P2P book, distributions from a private-equity vintage, staking rewards, and withholding tax on foreign dividends all compound — and the compounding pattern is invisible if income lives in five separate views. Without one view that holds them together, the obvious questions don't get asked: what's actually contributing, what's drying up, when does one source cross the line into covering a recurring expense.
How to actually track net worth — your real options
Four broad approaches, each with honest trade-offs. The right one depends less on what's technically possible than on how much complexity sits inside the household and how much setup effort the reader is willing to spend up front.
Doing nothing. The default, and the most common. The cost isn't dramatic in any single year — it's that every decision in the previous section gets made without data, usually anchored to whatever the brokerage app showed the last time the reader checked it. Workable for a household with one broker, no debt, and no non-stock assets. Less workable as soon as any of that changes.
A spreadsheet. Free, owned, and fine for one currency and a few listed holdings. Tracks balances cleanly if it's kept up. The math tends to break past the second broker or the first non-stock asset, and FX conversions plus corporate actions silently corrode the formulas over a few years. Still genuinely useful as a starting point for anyone willing to update it monthly — and many investors stay on this tier indefinitely without regret.
A portfolio tracker built for stocks. Captures the brokerage line well — performance, dividends, lots, tax — and is the right tool for judging investment strategy. The limitation is built into the model: real estate, private equity, options and liabilities are usually missing or second-tier, so the wealth side of the picture stays partial. Reasonable choice if the brokerage line is the only piece that needs deep analysis and net worth can be approximated separately.
An integrated wealth tracker. The one option of the four that covers everything the previous section is about — liabilities and non-listed assets alongside listed holdings, multi-currency with FX attribution, per-lot accounting and multi-jurisdiction tax handling, all from a single transaction ledger. Capitally is built that way: loans, mortgages and margin sit alongside stocks, ETFs, real estate, private equity and stock options as first-class types, in any number of currencies, with the analytics a portfolio tracker provides. The trade-off is a hands-on workflow — no aggregator integration by design, so broker data goes in via statement upload or CSV import — and the upside is less third-party credential exposure and a fuller transaction history than a balance feed gives you. The right shape if both lenses matter and the data sensitivity is real.
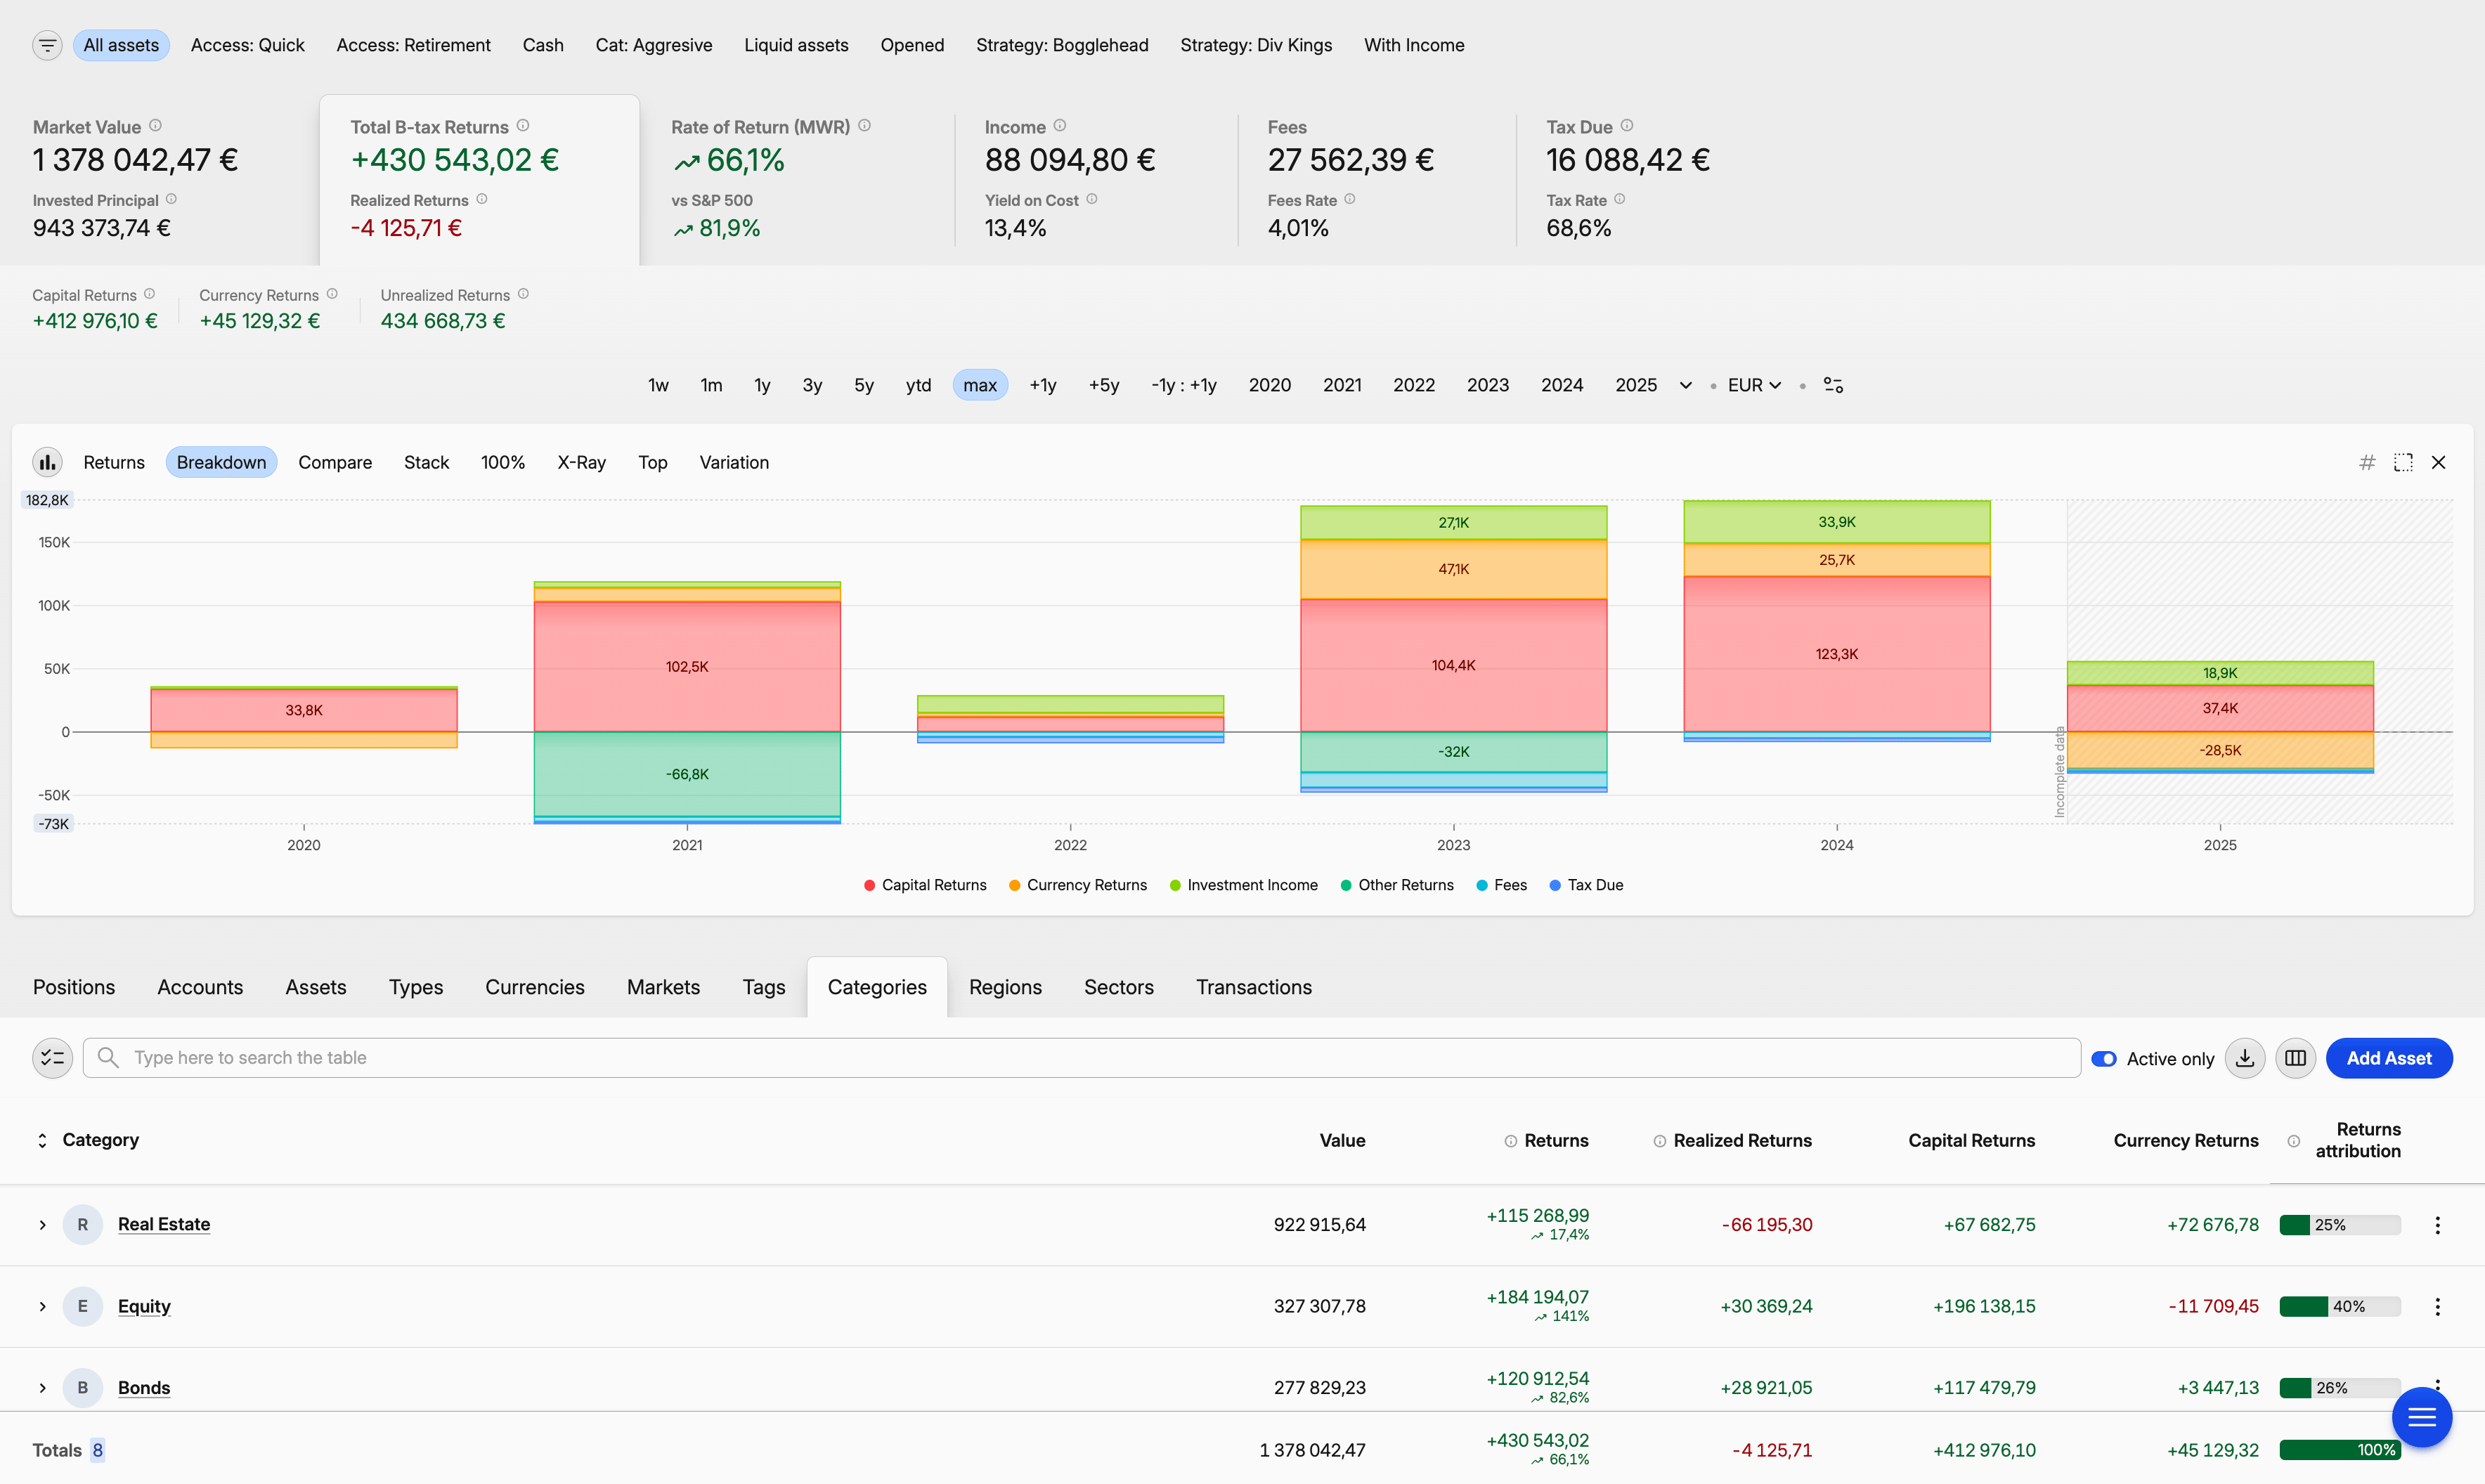 Capitally portfolio analysis across asset classes
For the metrics that go on top of any of these views — total return, MWR, TWR, IRR, the difference between them — Capitally's guide to tracking investments across brokers, currencies and asset types walks through them in order. Readers who want a head-to-head between named tools will find that in the comparison of portfolio trackers for the modern DIY investor; this piece is deliberately not a tool review.
The short answer
Track both. A portfolio tracker tells you whether the strategy is working. A net-worth view that includes liabilities and non-listed assets tells you whether the strategy is meaningful at the scale of the household. The right shape is one tool that does both — not two systems that don't talk to each other.
Common questions about net worth tracking
A portfolio tracker measures investment performance — total return, time-weighted return, money-weighted return, allocation, benchmark gap — across the brokerage accounts it can see. A net worth tracker adds the rest of the balance sheet: home equity, rental property, private equity, pensions, cash, and the debt sitting against any of it. The two answer different questions, and a useful tool covers both views from the same transaction history. Capitally does that natively, including liabilities as first-class positions.
Some can, most can't. Aggregator-based wealth dashboards usually show a mortgage or loan as a current balance pulled from the lender, which keeps net worth roughly accurate but ignores interest cost and amortization. Listed-securities-focused portfolio trackers commonly omit liabilities entirely. Capitally is built differently: loans and mortgages are first-class asset types with automatic interest accrual and amortization, margin and short positions are modelled explicitly, and Owned / Owed / Debt Ratio metrics run across the whole portfolio.
Use a tool that imports from broker statements or CSV files rather than connecting through an account aggregator. Statement imports keep credentials between the investor and the broker, and they typically carry the full transaction history (corporate actions, dividend reinvestments, FX conversions) that aggregator feeds tend to drop. Capitally is built on that model: on-device end-to-end encryption, no aggregator integration, and a column-matching importer that remembers each broker's mapping for next time.
Because portfolio performance answers strategy questions and net worth answers life questions, and most life questions don't sit inside the brokerage account. Affordability, real risk capacity, whether to pay down debt or invest, when to lower equity exposure before retirement — all of those depend on the household's total balance sheet, not on the brokerage slice. Investment performance on a minority share of total wealth is a useful number, but it's not the number that should drive most decisions.
Monthly is the right cadence for most households. Daily updates introduce noise — illiquid assets don't move daily and obsessive checking encourages bad decisions — and quarterly updates miss real drift between rebalancing windows. A monthly review of brokerage statements, an annual or semi-annual refresh of property and private-equity valuations, and a running ledger of liabilities is usually enough, and it matches how a portfolio tracker like Capitally is designed to be used.
An approximation is enough. The point of net worth tracking is awareness, not appraisal accuracy: a reasonable estimate of market value, refreshed once or twice a year, beats precisely tracking the brokerage account while ignoring the largest asset on the balance sheet. Recent comparable sales, a major listings site's automated estimate, or an annual professional appraisal for higher-value properties are all fine inputs. Capitally lets you enter the valuation manually and update it on the cadence you choose — no third-party data feed needed.