Capitally now includes a full library of economic indicators you can use as benchmarks, sourced directly from Eurostat, the OECD, and the World Bank. Compare your portfolio not just against stock indices, but against the things that actually matter in everyday life — inflation, housing costs, interest rates, and economic growth.
The following indicators are available for 60+ countries:
- CPI — Consumer Price Index (national)
- HICP — Harmonised Index of Consumer Prices (EU-wide methodology)
- HPI — House Price Index
- CBRATE — Central Bank policy rate
- GB3M / GB10Y — 3-month and 10-year government bond yields
- GDP — GDP growth
When to use them
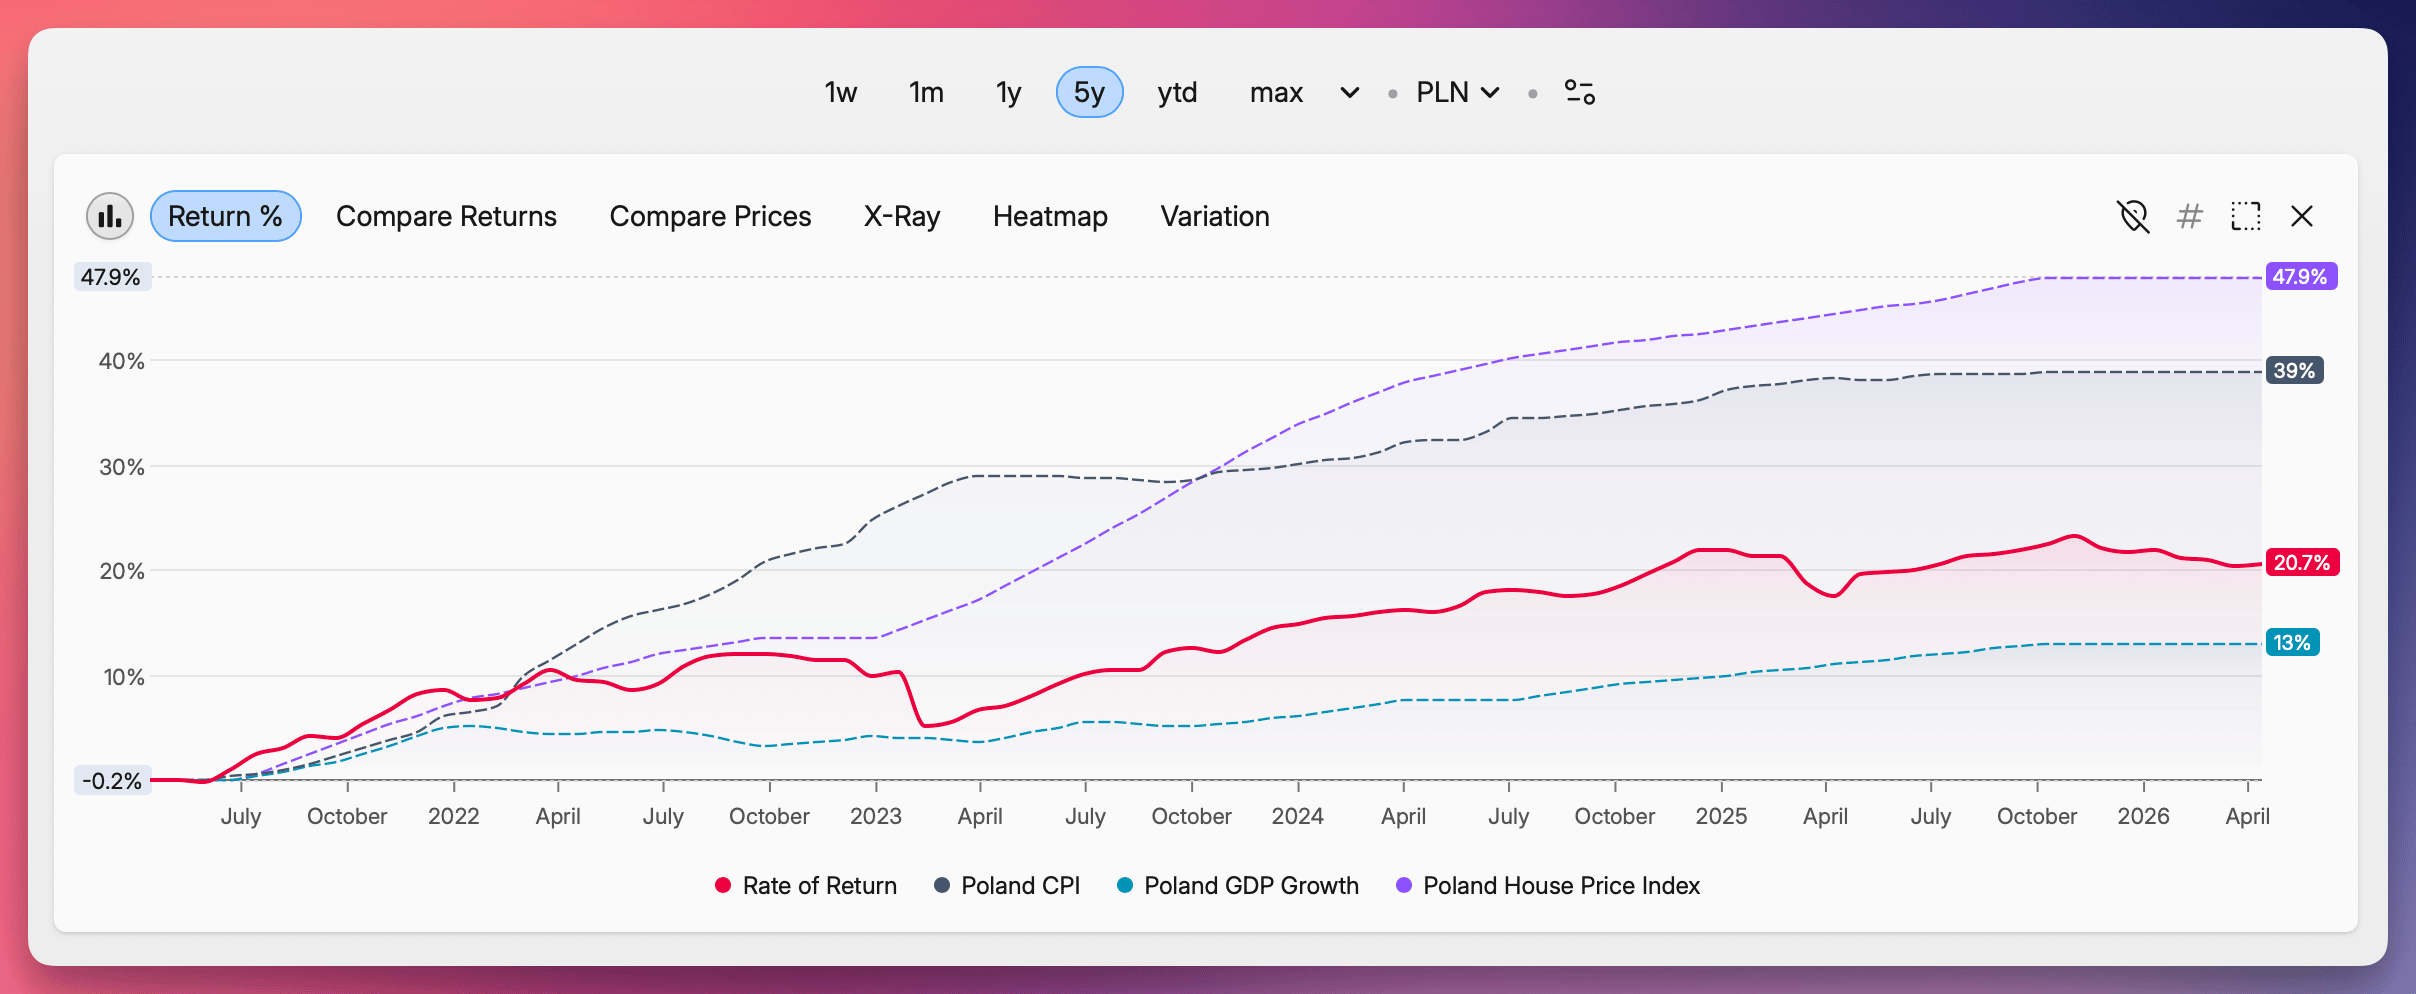
These work just like any other benchmark — Capitally plots them alongside your portfolio so you can see, at a glance, whether you're ahead or behind. Some examples of when each one is useful:
- Am I keeping up with inflation?
Add US CPI or Poland CPI next to your portfolio and check whether your return line sits above or below it. - How does my real-estate portfolio compare to the overall housing market?
Germany HPI or UK HPI show the average movement of home prices in that country — a natural yardstick for any property you hold there. - Is cash still a reasonable choice?
US 10Y Government Bond Yield or Eurozone Central Bank Rate tell you what a near-risk-free return would have looked like over the same period. - How is the broader economy doing?
France GDP or Japan GDP give you a long-term macro reference to compare against.
How to find them
Open the benchmark picker anywhere you'd normally add a benchmark — and search by the country name and the indicator. Typing Germany stats brings up every German indicator; typing germany cpi or DE-CPI brings up inflation for that country.