Risk metrics — drawdowns, volatility, Value at Risk and correlation
This release adds risk metrics: how rough the ride was, not just how far you got. They work for any position, account, asset type or tag, over the period you select.
Drawdown chart
A new Drawdown preset on the Rate of Return view shows how far your portfolio sat below its peak, with your benchmarks as dashed lines.
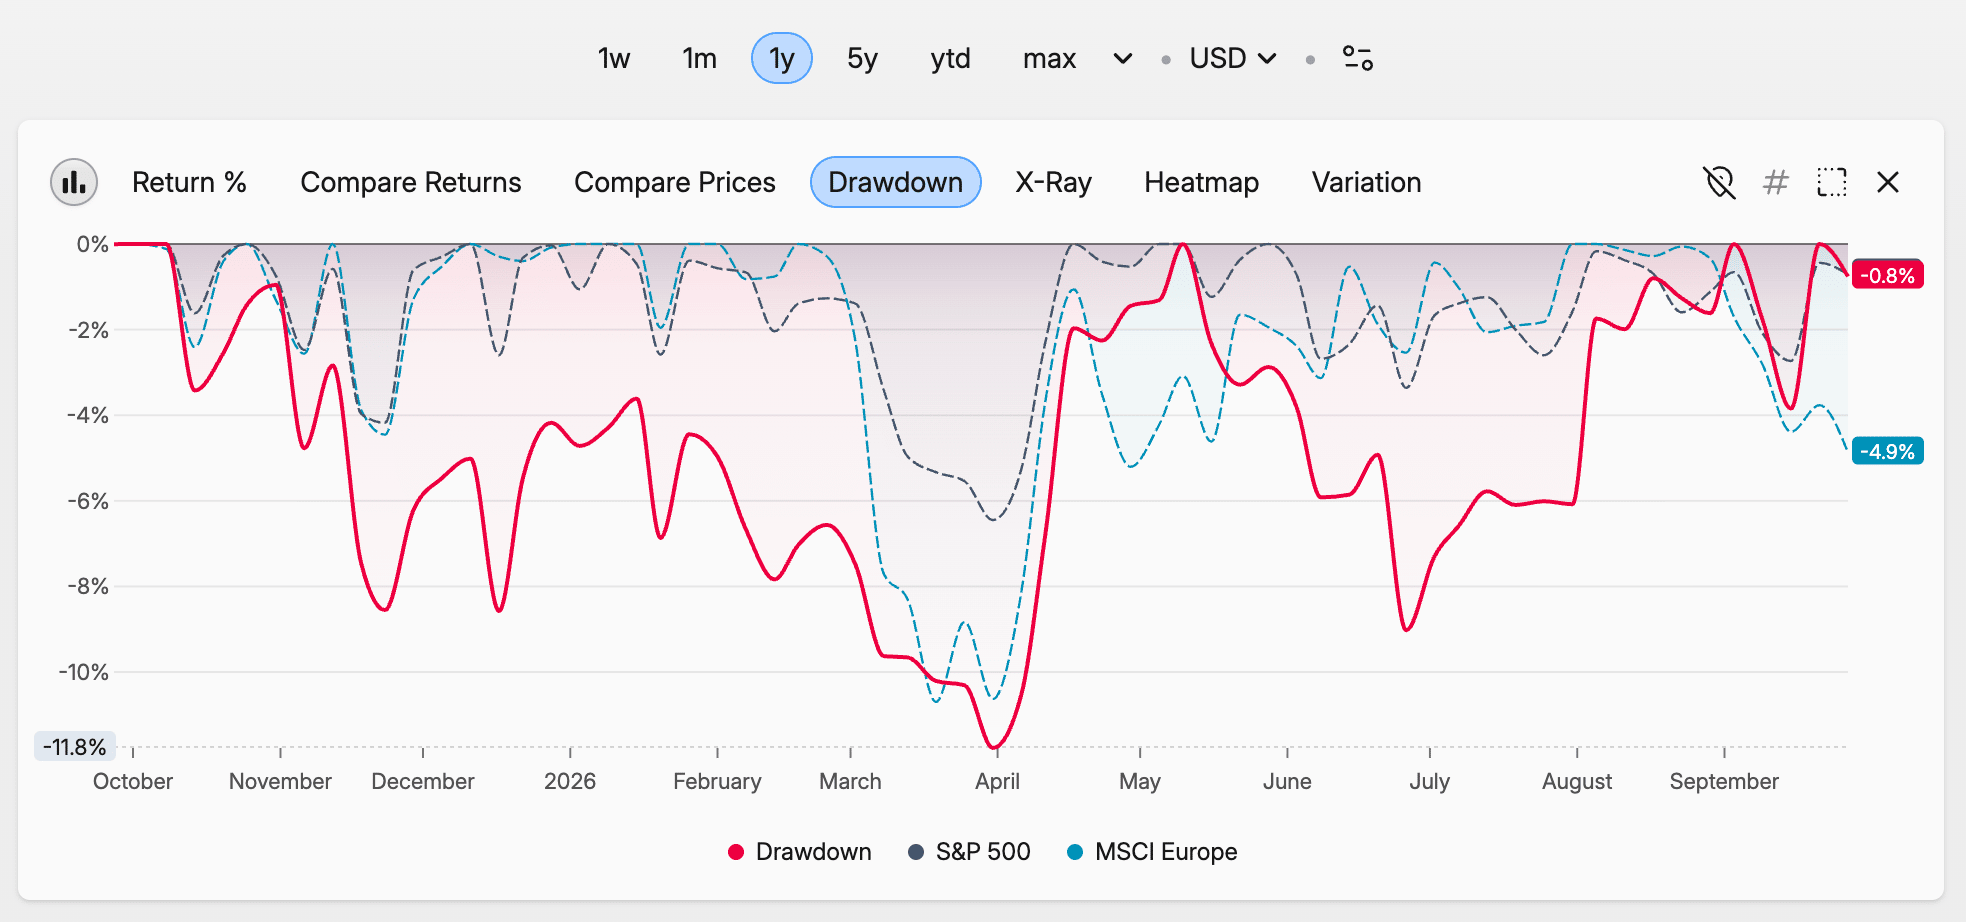
New columns
- Drawdown, Deepest Drawdown and Longest Drawdown show the current decline from the period's peak, the largest fall and the longest stretch underwater, with dates and length in days.
- Volatility and Sharpe Ratio show annualized volatility and return per unit of risk, against your own risk-free rate or the 3-month US T-bill.
- Value at Risk % and Value at Risk show what could be lost over the next 30 days with 95% confidence. A holding with 25% annual volatility reads about 12%.
- Correlation shows how closely each row moves with your first benchmark, from 1 (together) to −1 (opposite).
- Regional and Sector Diversification give a Herfindahl score where 1.0 means all in one place and lower means more spread out.
Each column except diversification also has a (Prices) variant. The plain one follows your actual, time-weighted history. The (Prices) one measures today's holdings as if you'd held them all period.
Switch them on under Risk Metrics in the columns menu, or pick them in the chart editor. See Risk metrics for the details.
Upload your own images
On paid plans you can upload your own profile image by clicking your avatar in Profile settings, or keep editing your Gravatar from the same menu. The icon picker for accounts, assets, markets and tags has a new Upload tab: pick a file or paste an image with Paste or Ctrl/⌘+V. Uploaded icons are kept in a per-project library for reuse. Icon images are encrypted in your browser before upload, like the rest of your portfolio data. Profile images are public, since they're shown as your avatar.