Calculating how well your investments are doing can be tricky. There are lots of things that can change how much money you make, and different ways to figure it out. It's important for you to know what the numbers mean.
Some apps and brokers don't explain clearly how they work out your returns, which can be confusing. But with Capitally, you can pick what to include in your returns and choose how to calculate them.
Money Weighted Return (MWR / IRR)
Money Weighted Return (MWR), also known as Internal Rate of Return (IRR), is like an interest rate on a deposit account that exactly matches your portfolio's cash flows.
Read more about Money Weighted Rate of Return on our blog.
Time Weighted Return (TWR)
TWR measures the return from your asset mix only, ignoring your actions.
Imagine you invest equal amounts in each asset based on its allocation. For one asset, you invest $100. For two assets with an 80% & 20% mix, you invest $80 and $20. If you change the allocation, you rebalance the dollar amounts accordingly.
Returns are based on End-of-Day prices. Your actions, other than choosing the asset mix, don't affect the returns.
Read more about Time Weighted Rate of Return on our blog.
Return on Investment (ROI)
ROI tracks all your cash flows, regardless of timing. It records everything you put in and take out of the portfolio as inflows and outflows. The ROI is calculated as outflows / inflows - 1.
Our algorithm ensures that money taken out and later put back in isn't counted twice. It does this by tracking the maximums of flows in both directions.
ROI is a simple measure and should be used with an understanding of its limitations. However, it can be useful for removing the effect of timing, such as when evaluating Dollar Cost Averaging by comparing ROI to TWR.
Read more about Return on Investment on our blog.
Annualizing Rate of Return
Capitally does not automatically annualize rates. Instead, it shows the percentage gained or lost over the entire period.
This is useful for seeing a large number over a long time, but it doesn’t help compare different time periods. It’s also much easier to understand "10% per year" than "61% over 5 years."
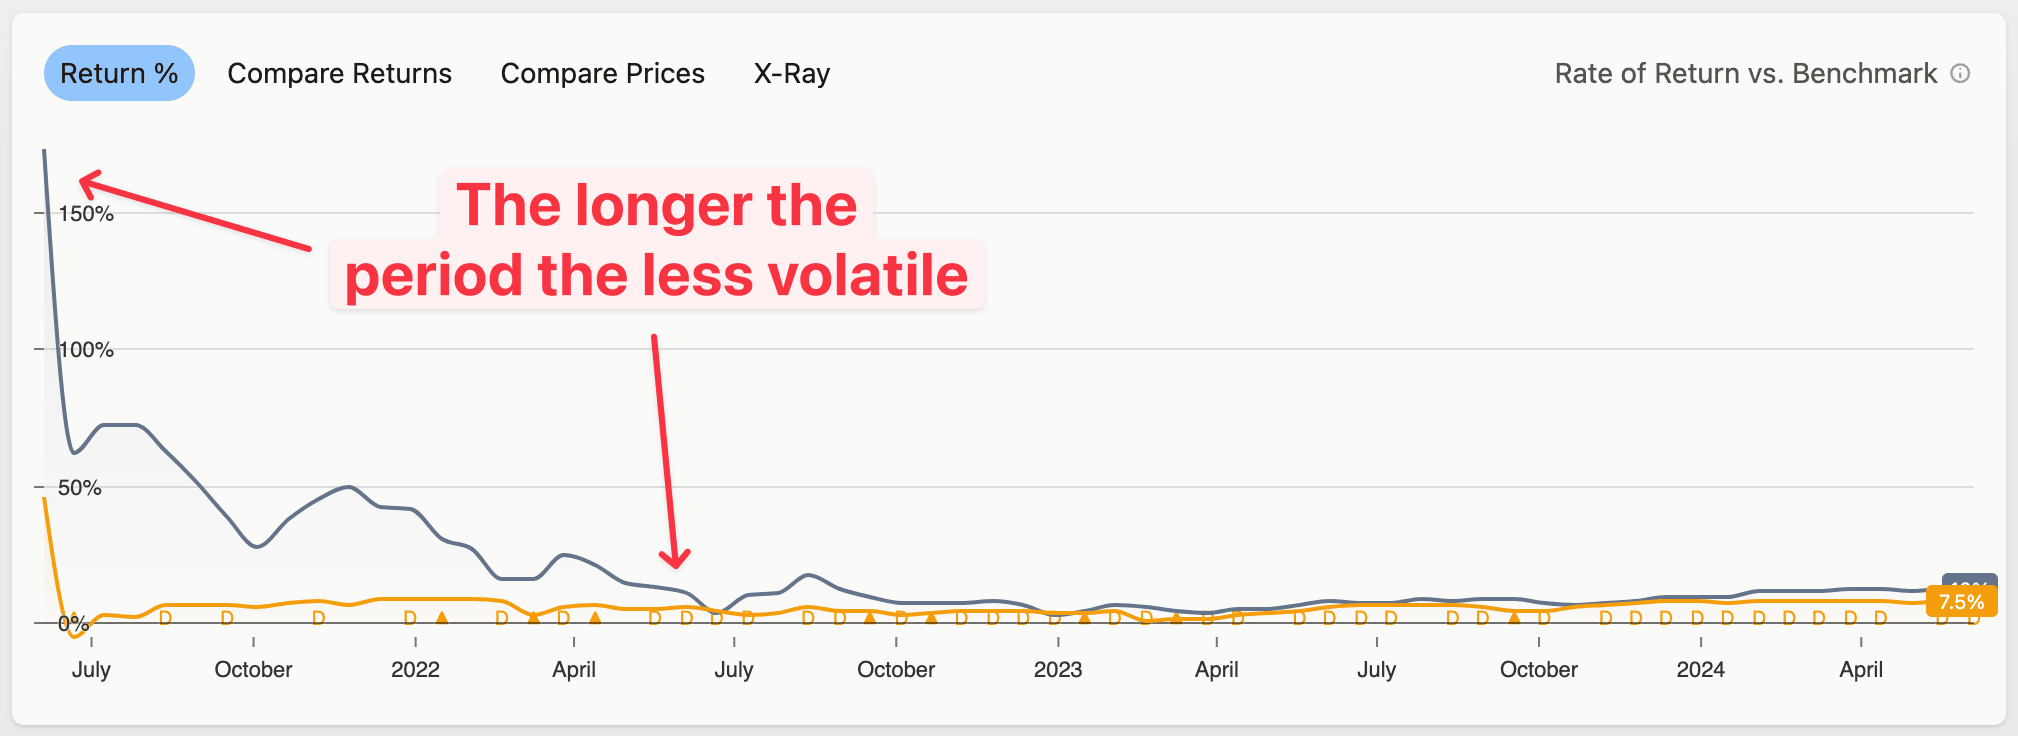
Therefore you can choose to annualize the returns. We recommend the Auto option, which annualizes returns for periods of at least 1 year.
p.a. or pa which stands for "per annum".Annualizing shorter periods can help predict earnings, but it’s mostly useful for fixed-income sources like deposits or bonds. For other assets, volatility can greatly affect the numbers, as shown in the following graph:
What is included in returns
By default, returns include Fixed Income, Fees and Other cashflows (from "Other" transactions). This gives you the Total Return.
You can adjust these options to get different types of returns:
- Price Return: exclude everything
- Nominal Return: include only Fixed Income
Including Taxes
If you have taxes set up, you can include them in your returns:
- Paid: Includes only the tax declared as paid in transactions (like tax withheld)
- Due: Includes tax you paid and tax that is due from realized gains
- Potential: includes all taxes, including tax that would be due if you closed all your positions on the last day
Discounting by a benchmark
A discount benchmark subtracts a chosen benchmark's rate of return from your own rate of return. The result is your real return (after inflation) or excess return (after a chosen index).
Common uses:
- Real return after inflation — discount by US CPI, Poland CPI, or any other inflation indicator
- Alpha vs the market — discount by S&P 500, MSCI World, or your favourite index
- Premium over risk-free — discount by US 10Y Government Bond Yield or another bond yield
Open the Rate of Return tab in Portfolio and pick a benchmark from the Discount by selector, right next to the regular benchmark picker. The discount applies to every rate-of-return method — TWR, IRR, and ROI alike.
See Benchmarks for the full list of suitable benchmarks and how the math works.
Modifying options
Globally
To set default options for the entire application:
- Go to Settings
- Select Analysis
- Change the options
- Click Save
In Portfolio
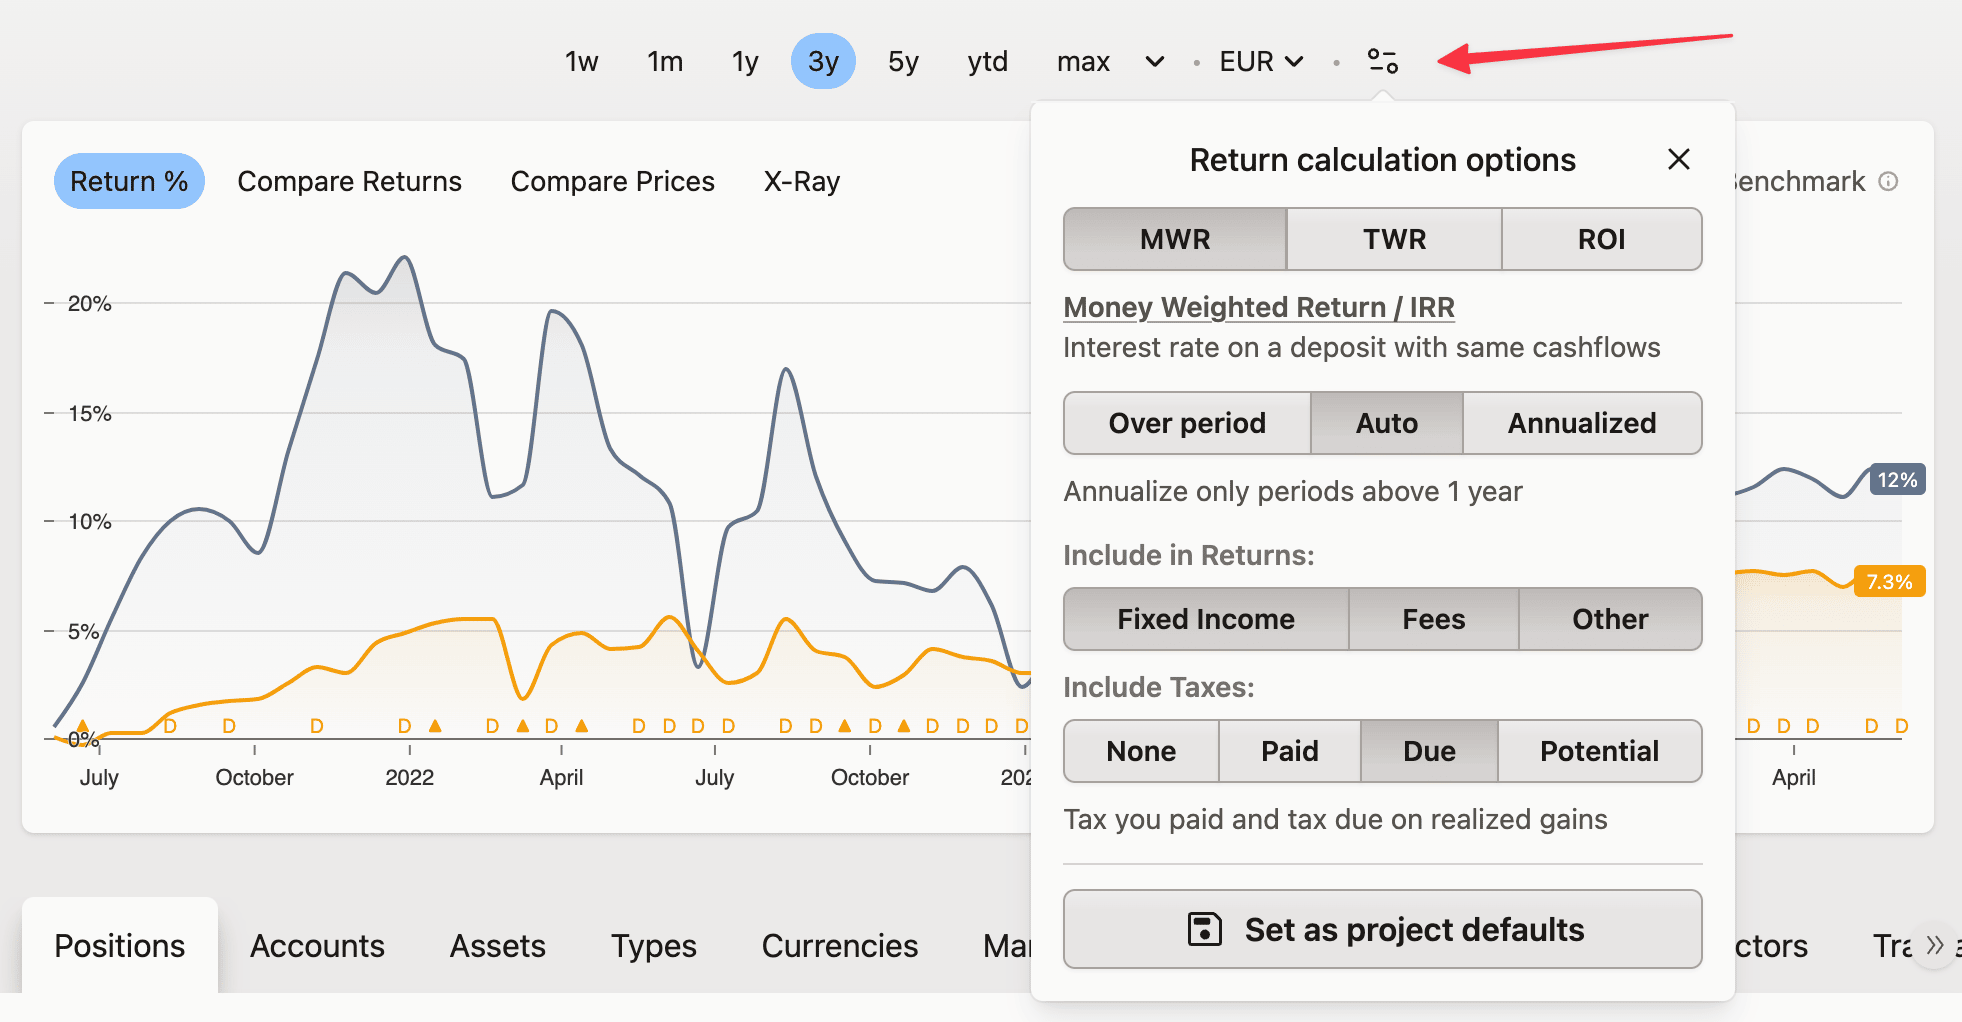
To change calculation options within your portfolio:
- Click the button next to the currency selector.
- Your changes will take effect immediately.
- To apply these changes elsewhere in the app, save the new settings as default.
How returns are calculated
This is how your data is used to calculate the performance:
- All transactions are grouped into positions. In each group there are only transactions with the same asset and account.
- Automatic transactions are generated, like dividends or splits.
- Transactions are ordered in ascending order by their dates. If the date is the same, Splits go first, then Dividends, Buys, Sells and the rest.Order of two transactions with the same type and date is not defined. It will not be the same as the order they've been added. If it's important, add one minute to date of one of the transactions.
- Transactions are combined into Position Units in the First-In-First-Out order.
- All prices are converted to a selected viewing currency. When calculating Capital/Currency return, we use a constant FX rate from the day when Position Unit was opened.
- All selected Position Units are then aggregated. Their metrics are calculated for each relevant day - like start and end of the period, or days of transaction activity. These metrics include cashflows, fees, fixed income and everything needed to calculate the returns and ratesAll calculations are limited to 9 decimal places. Numbers are constantly rounded to minimize errors.
- Finally, the returns and rates are calculated by aggregating these metricsMWR is calculated through trial and error, starting with a ROI estimate and then using the Newton-Raphson method. Up to 100 tries and accepting answers within 0.1% accuracy. If the rate cannot be found,
NaNis shown which stands forNot a Number.