Capitally provides full support for tracking stock options, including automated imports, Greeks, strategy grouping, and margin tracking. Whether you're buying puts, selling covered calls, or trading complex multi-leg strategies, you can monitor everything in one place.
How to get options into Capitally?
Importing from a broker
Options are automatically imported when you import transactions from a broker. We currently support Interactive Brokers.
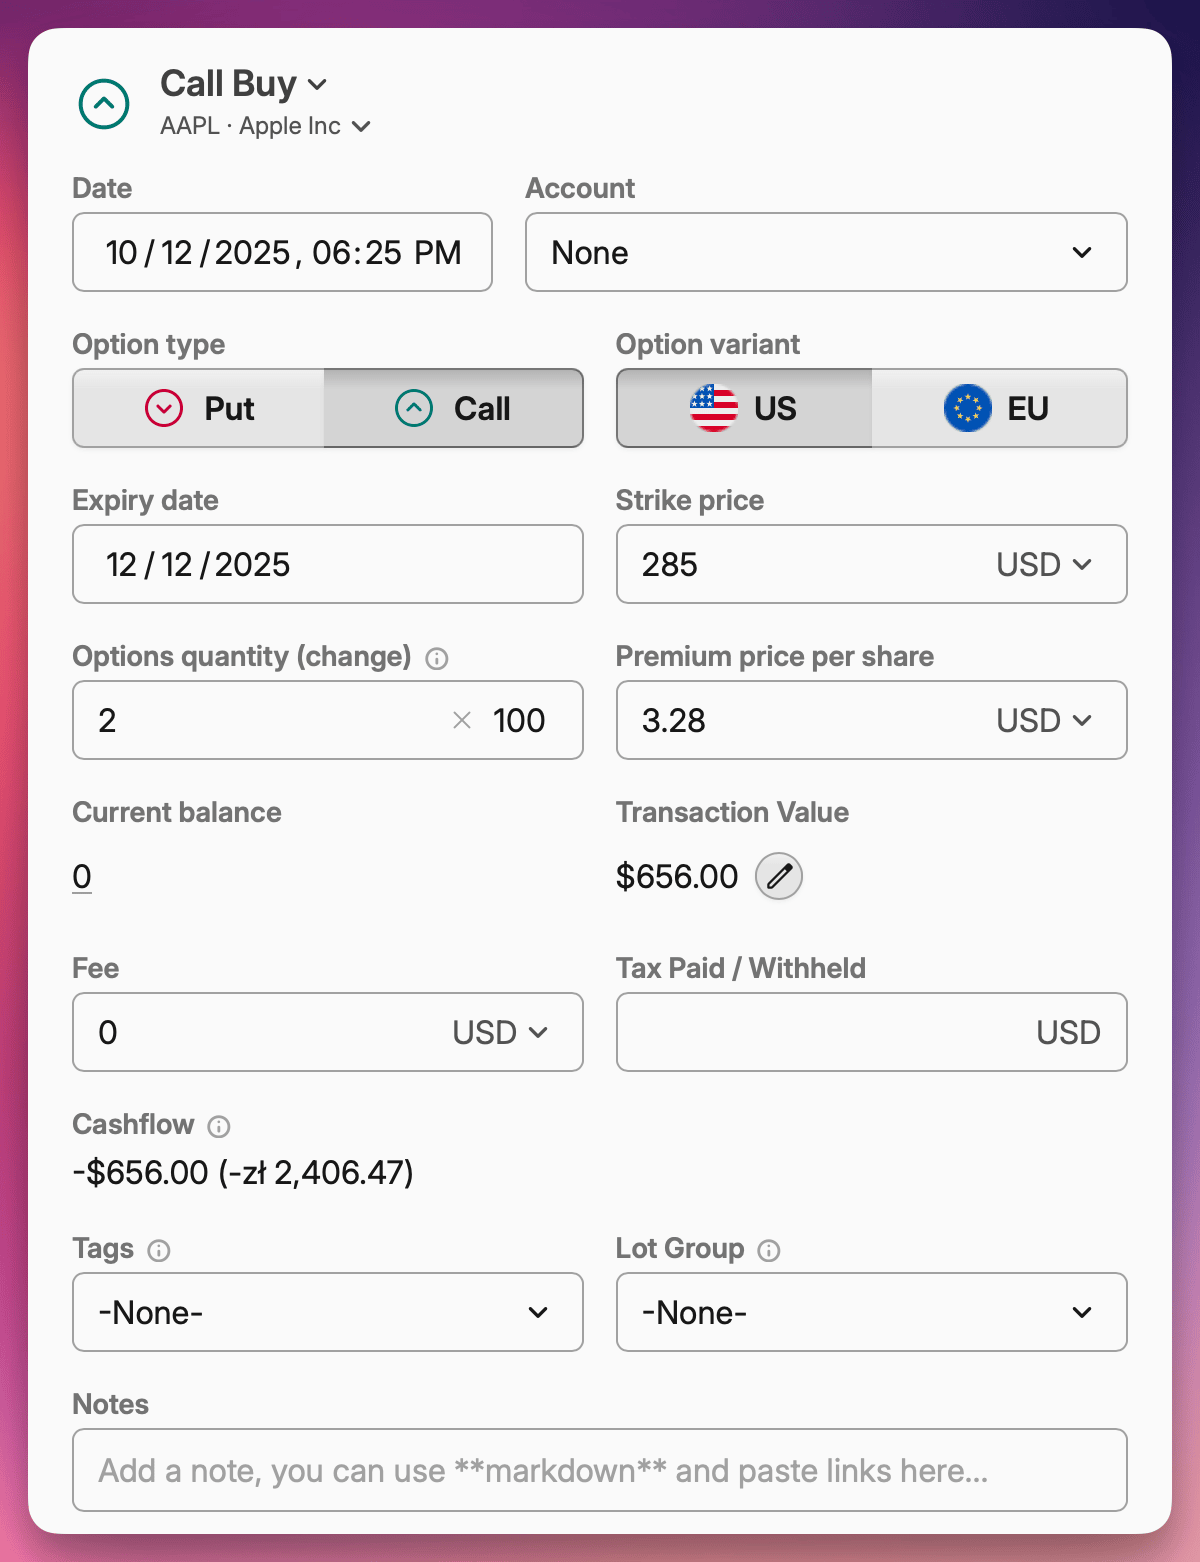
Adding options manually
You can add option transactions for any underlying asset — stocks, ETFs, indices, or commodities.
- Click Add asset anywhere in the application
- Search for and select the underlying asset (e.g., Apple stock)
- Choose Stock option as the transaction type
- Fill in the option details:
- Account where the option is held
- Expiry date
- Option type (put or call)
- Strike price
- Quantity (number of contracts)
- Multiplier (typically 100 for standard options)
- Premium per share
This single Stock option transaction type is used for everything - buying, selling, expiring or exercising options. Simply use:
- Positive quantity when buying
- Negative quantity when selling
- Empty premium price upon expiry, along with a transaction date on or after expiry date and appropriate quantity (negative when expiring longs, and positive for shorts)
- Enable Option has been excercised for exercised options, along with a transaction date on or after expiry date and appropriate quantity (negative when expiring longs, and positive for shorts)
How to view options in your portfolio?
Once you have options entered, they appear as transaction lots under the underlying asset. For example, if you bought Apple options, navigate to your Apple position and you'll see both your regular stock lots and option lots together under the Lots tab.
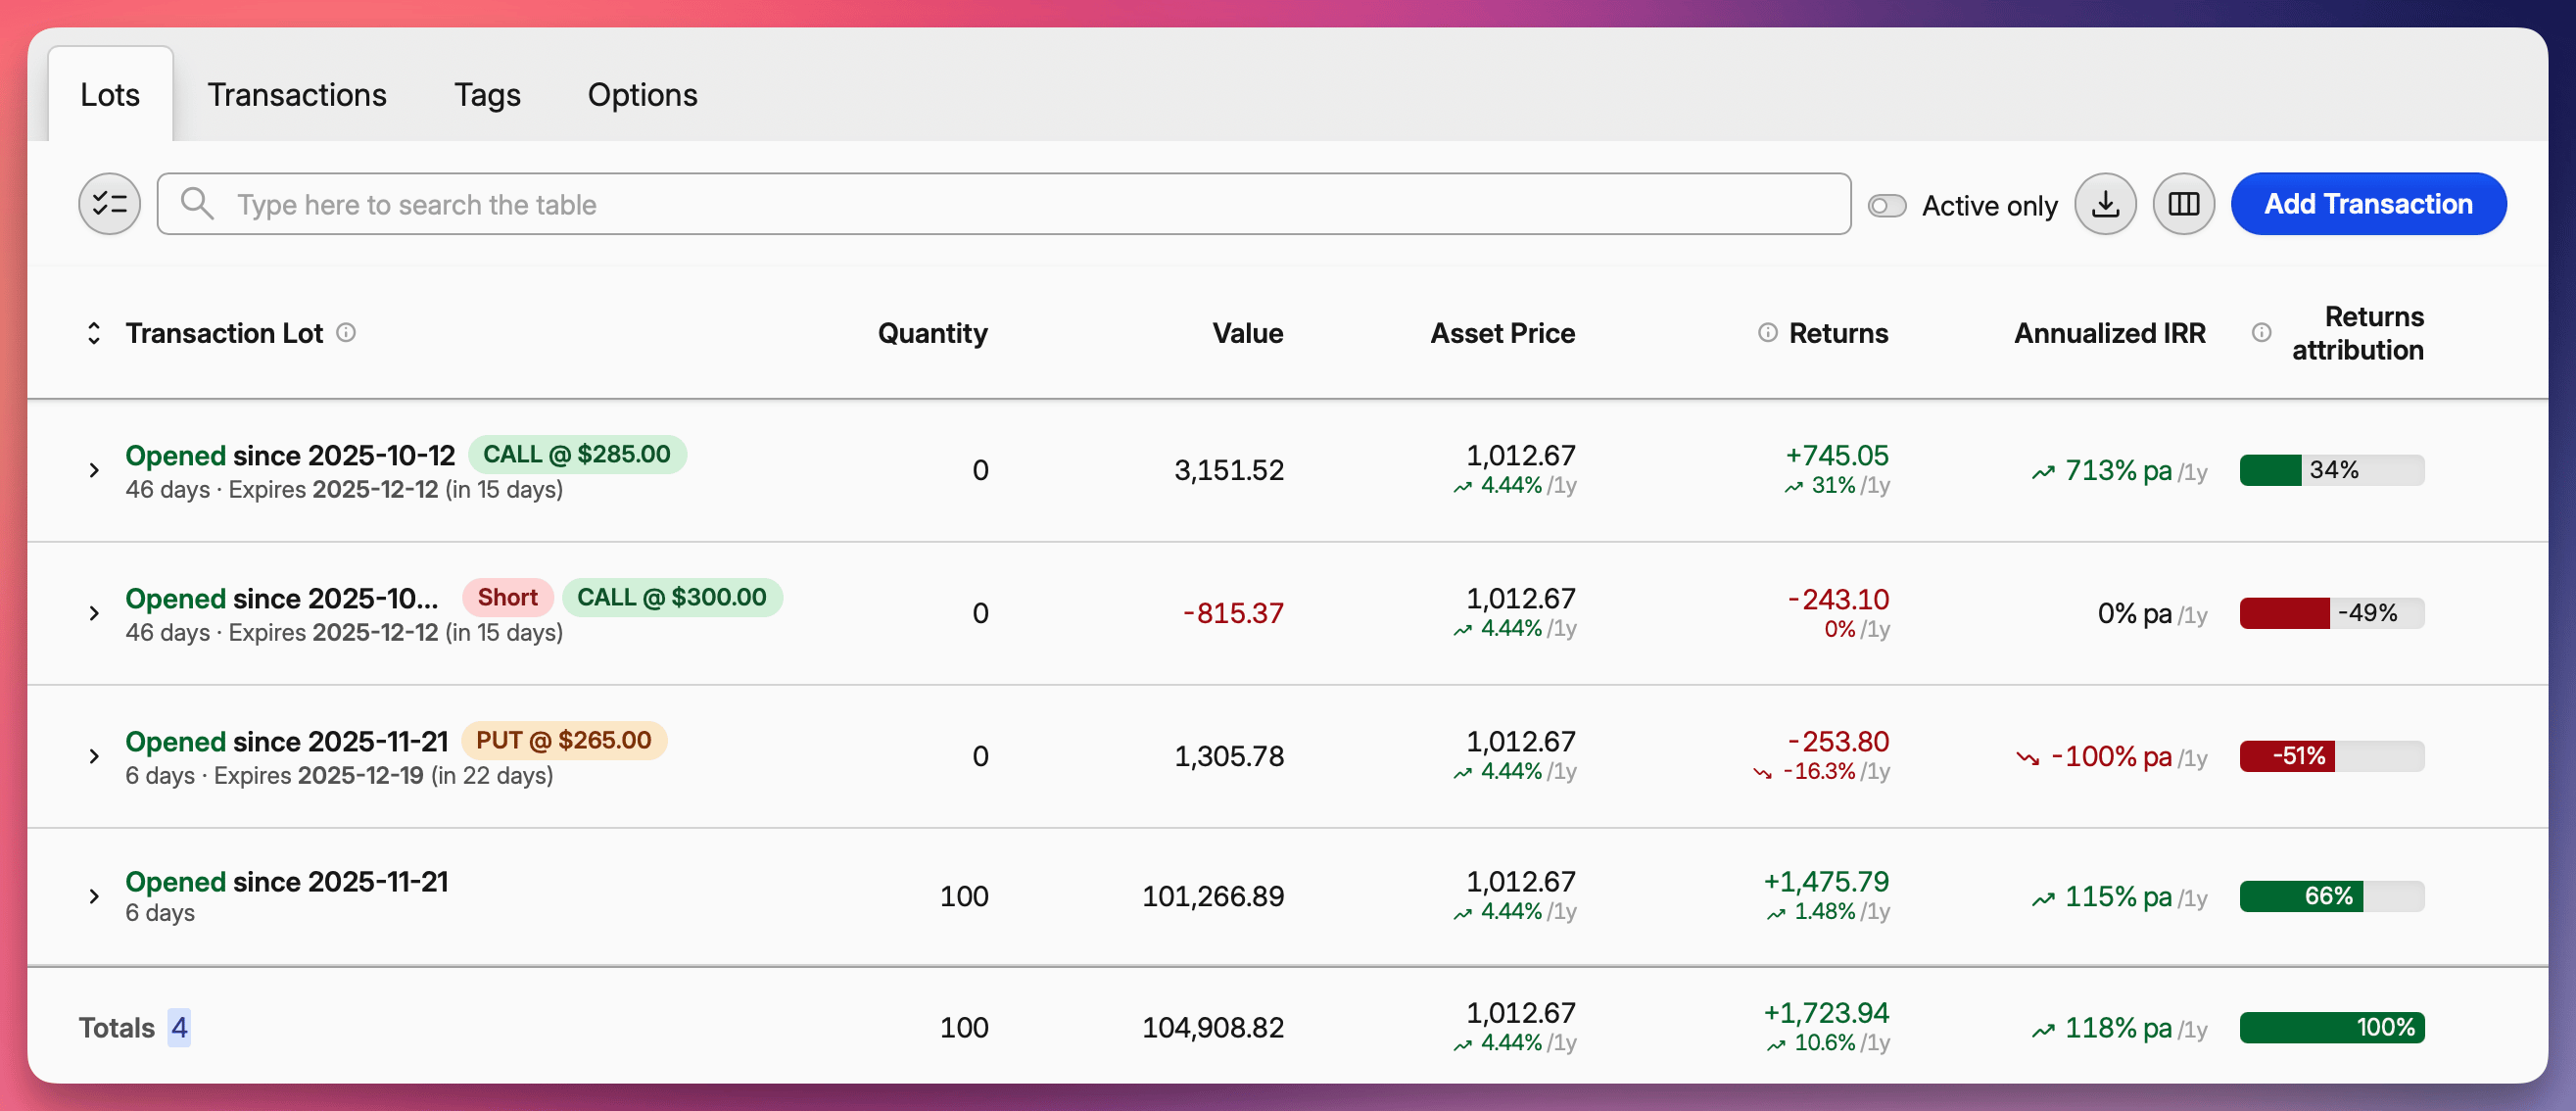 Option lots displayed among regular stock lots
Enable the dedicated options tab
For a cleaner view when actively trading options, enable the dedicated options interface:
- Go to Settings
- Find the Advanced tracking section
- Enable Options grouping
This adds a new Options tab at every level of your portfolio. Whether you're looking at a specific asset, an account, or your entire wealth, this tab aggregates all relevant options in one place.
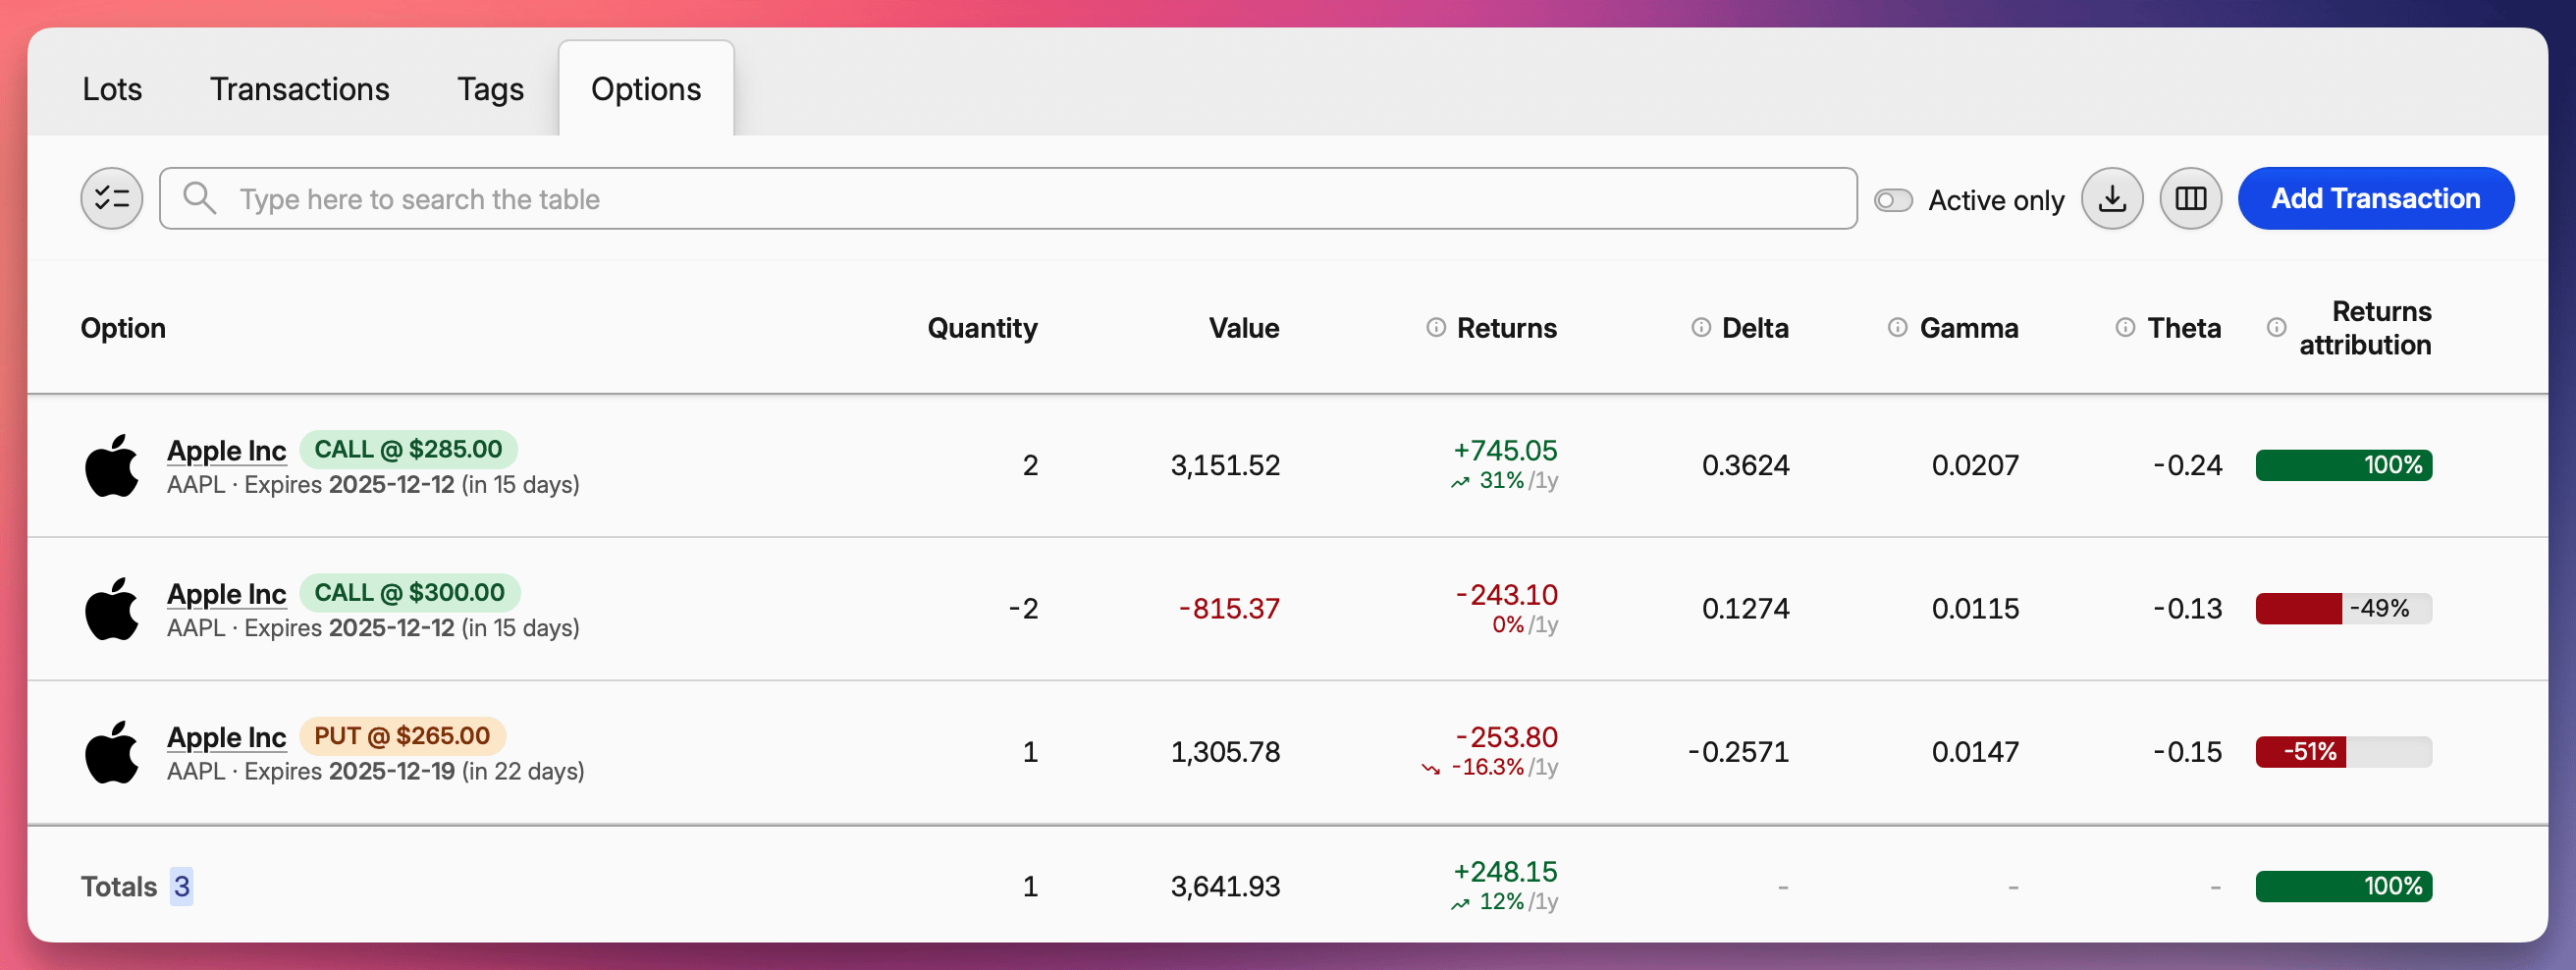 Dedicated options tab
Grouping options into strategies
You can organize related trades into lot groups to analyze strategies rather than individual legs.
To create a group manually:
- Navigate to your Options or Lots tab
- Select the positions you want to group by checking their checkboxes
- Click Lot group from the panel at the bottom
- Choose an existing group or create a new one
Lot groups can be nested, allowing you to build complex structures. For example, you might have a "Wheel Strategy" group containing sub-groups for each expiration cycle.
You can group multiple option legs together (spreads, condors) or combine options with regular stock lots (covered calls with the underlying shares).
Automatic strategy grouping
Capitally can detect and group common option strategies automatically:
- Go to Settings → Advanced tracking
- Enable Automatically group option strategies into lot groups
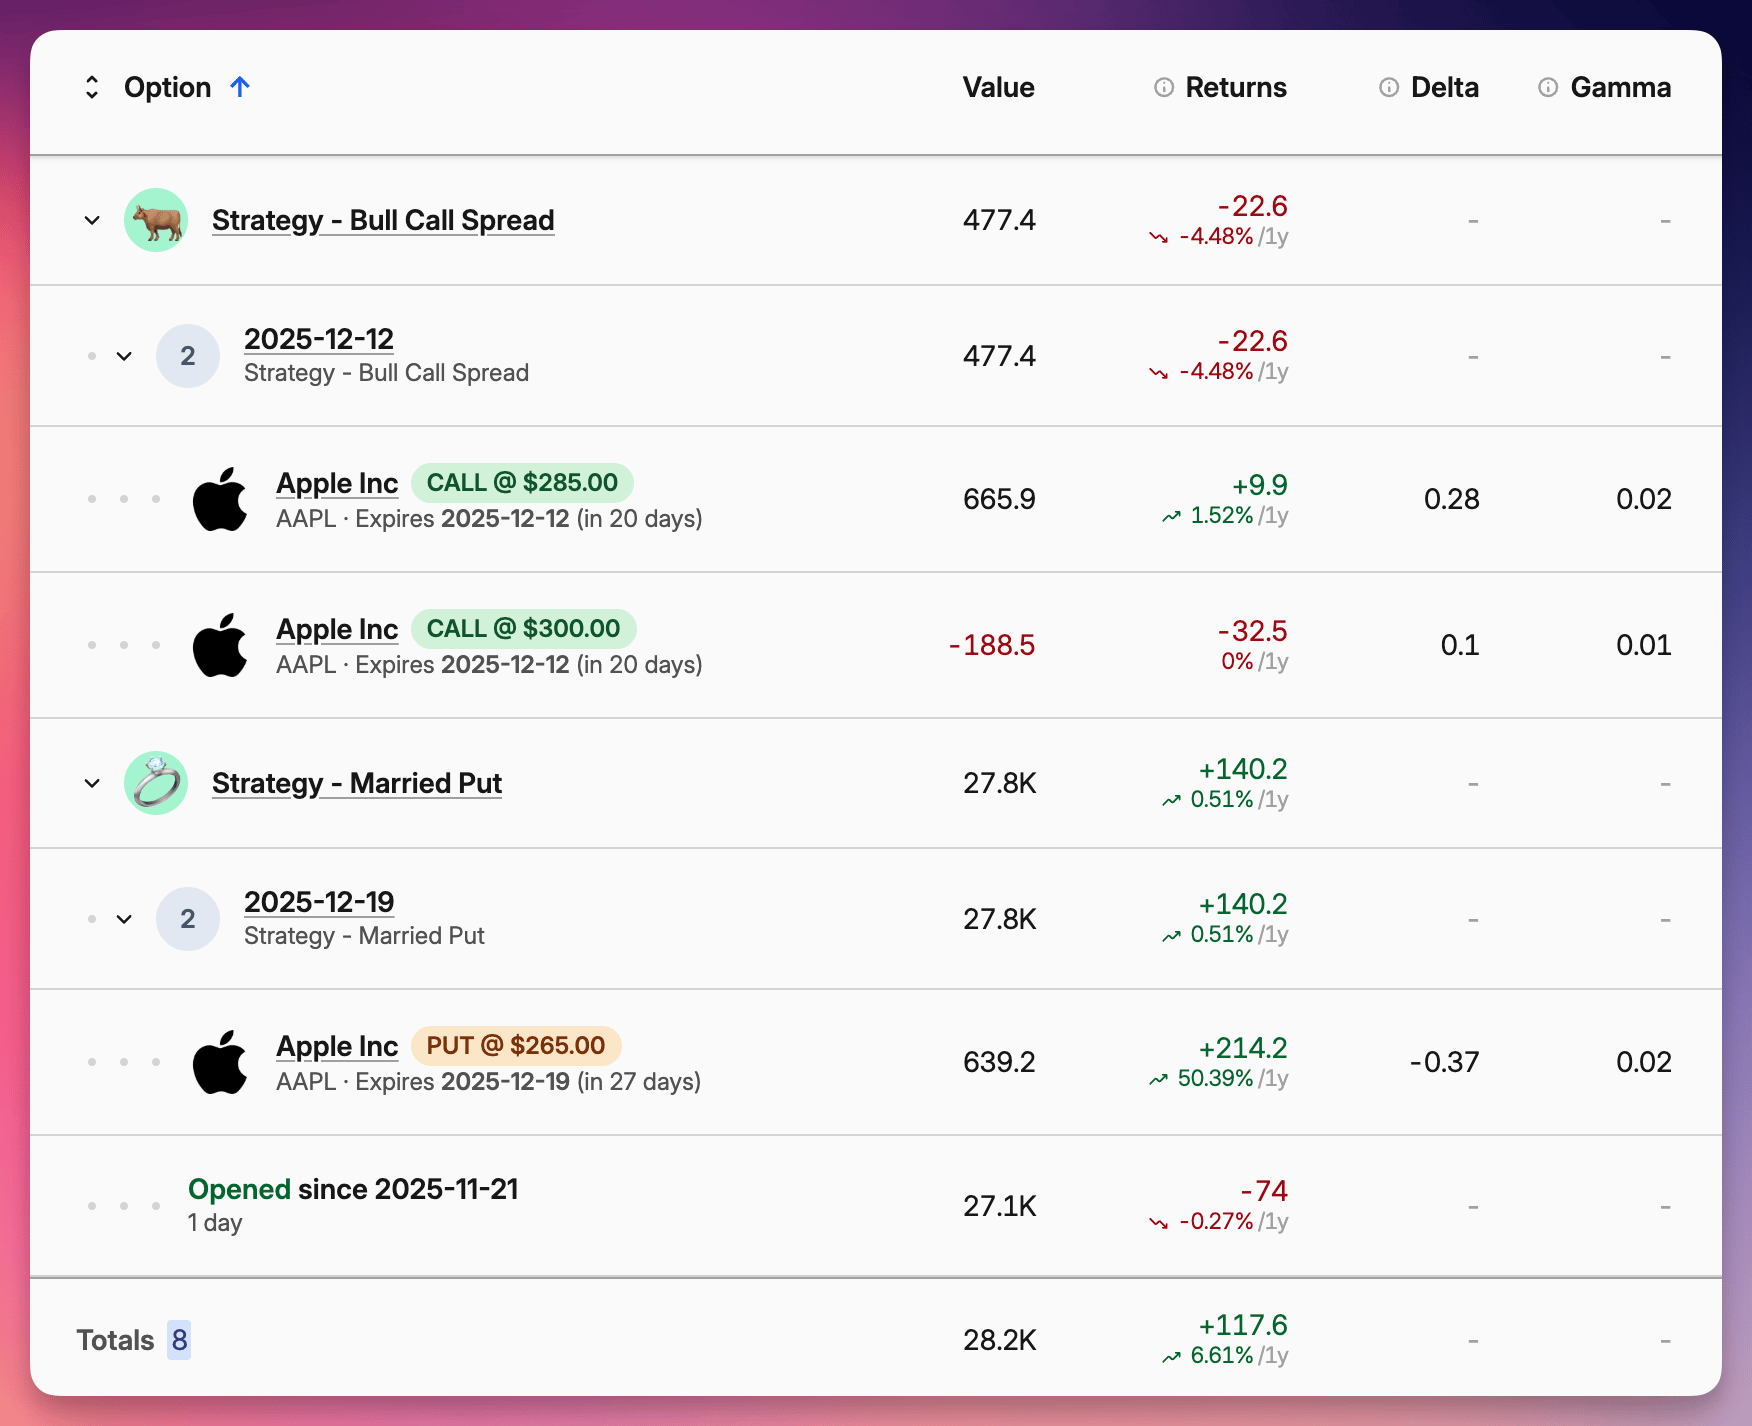
When enabled, Capitally recognizes strategies like covered calls, iron condors, strangles, and others. It groups all legs together with the strategy name as the top-level group and expiry dates as sub-groups.
You can expand any group to see individual legs and their performance, or view aggregated metrics for the entire strategy.
Options analytics
The options table includes columns for option Greeks. By default, only Delta is visible, but you can configure the table to show:
- Delta — sensitivity to underlying price changes
- Gamma — rate of change of delta
- Theta — time decay
- Vega — sensitivity to volatility changes
- Rho — sensitivity to interest rate changes
You can also display columns for strike price, option type, and position breakdown (puts vs. calls).
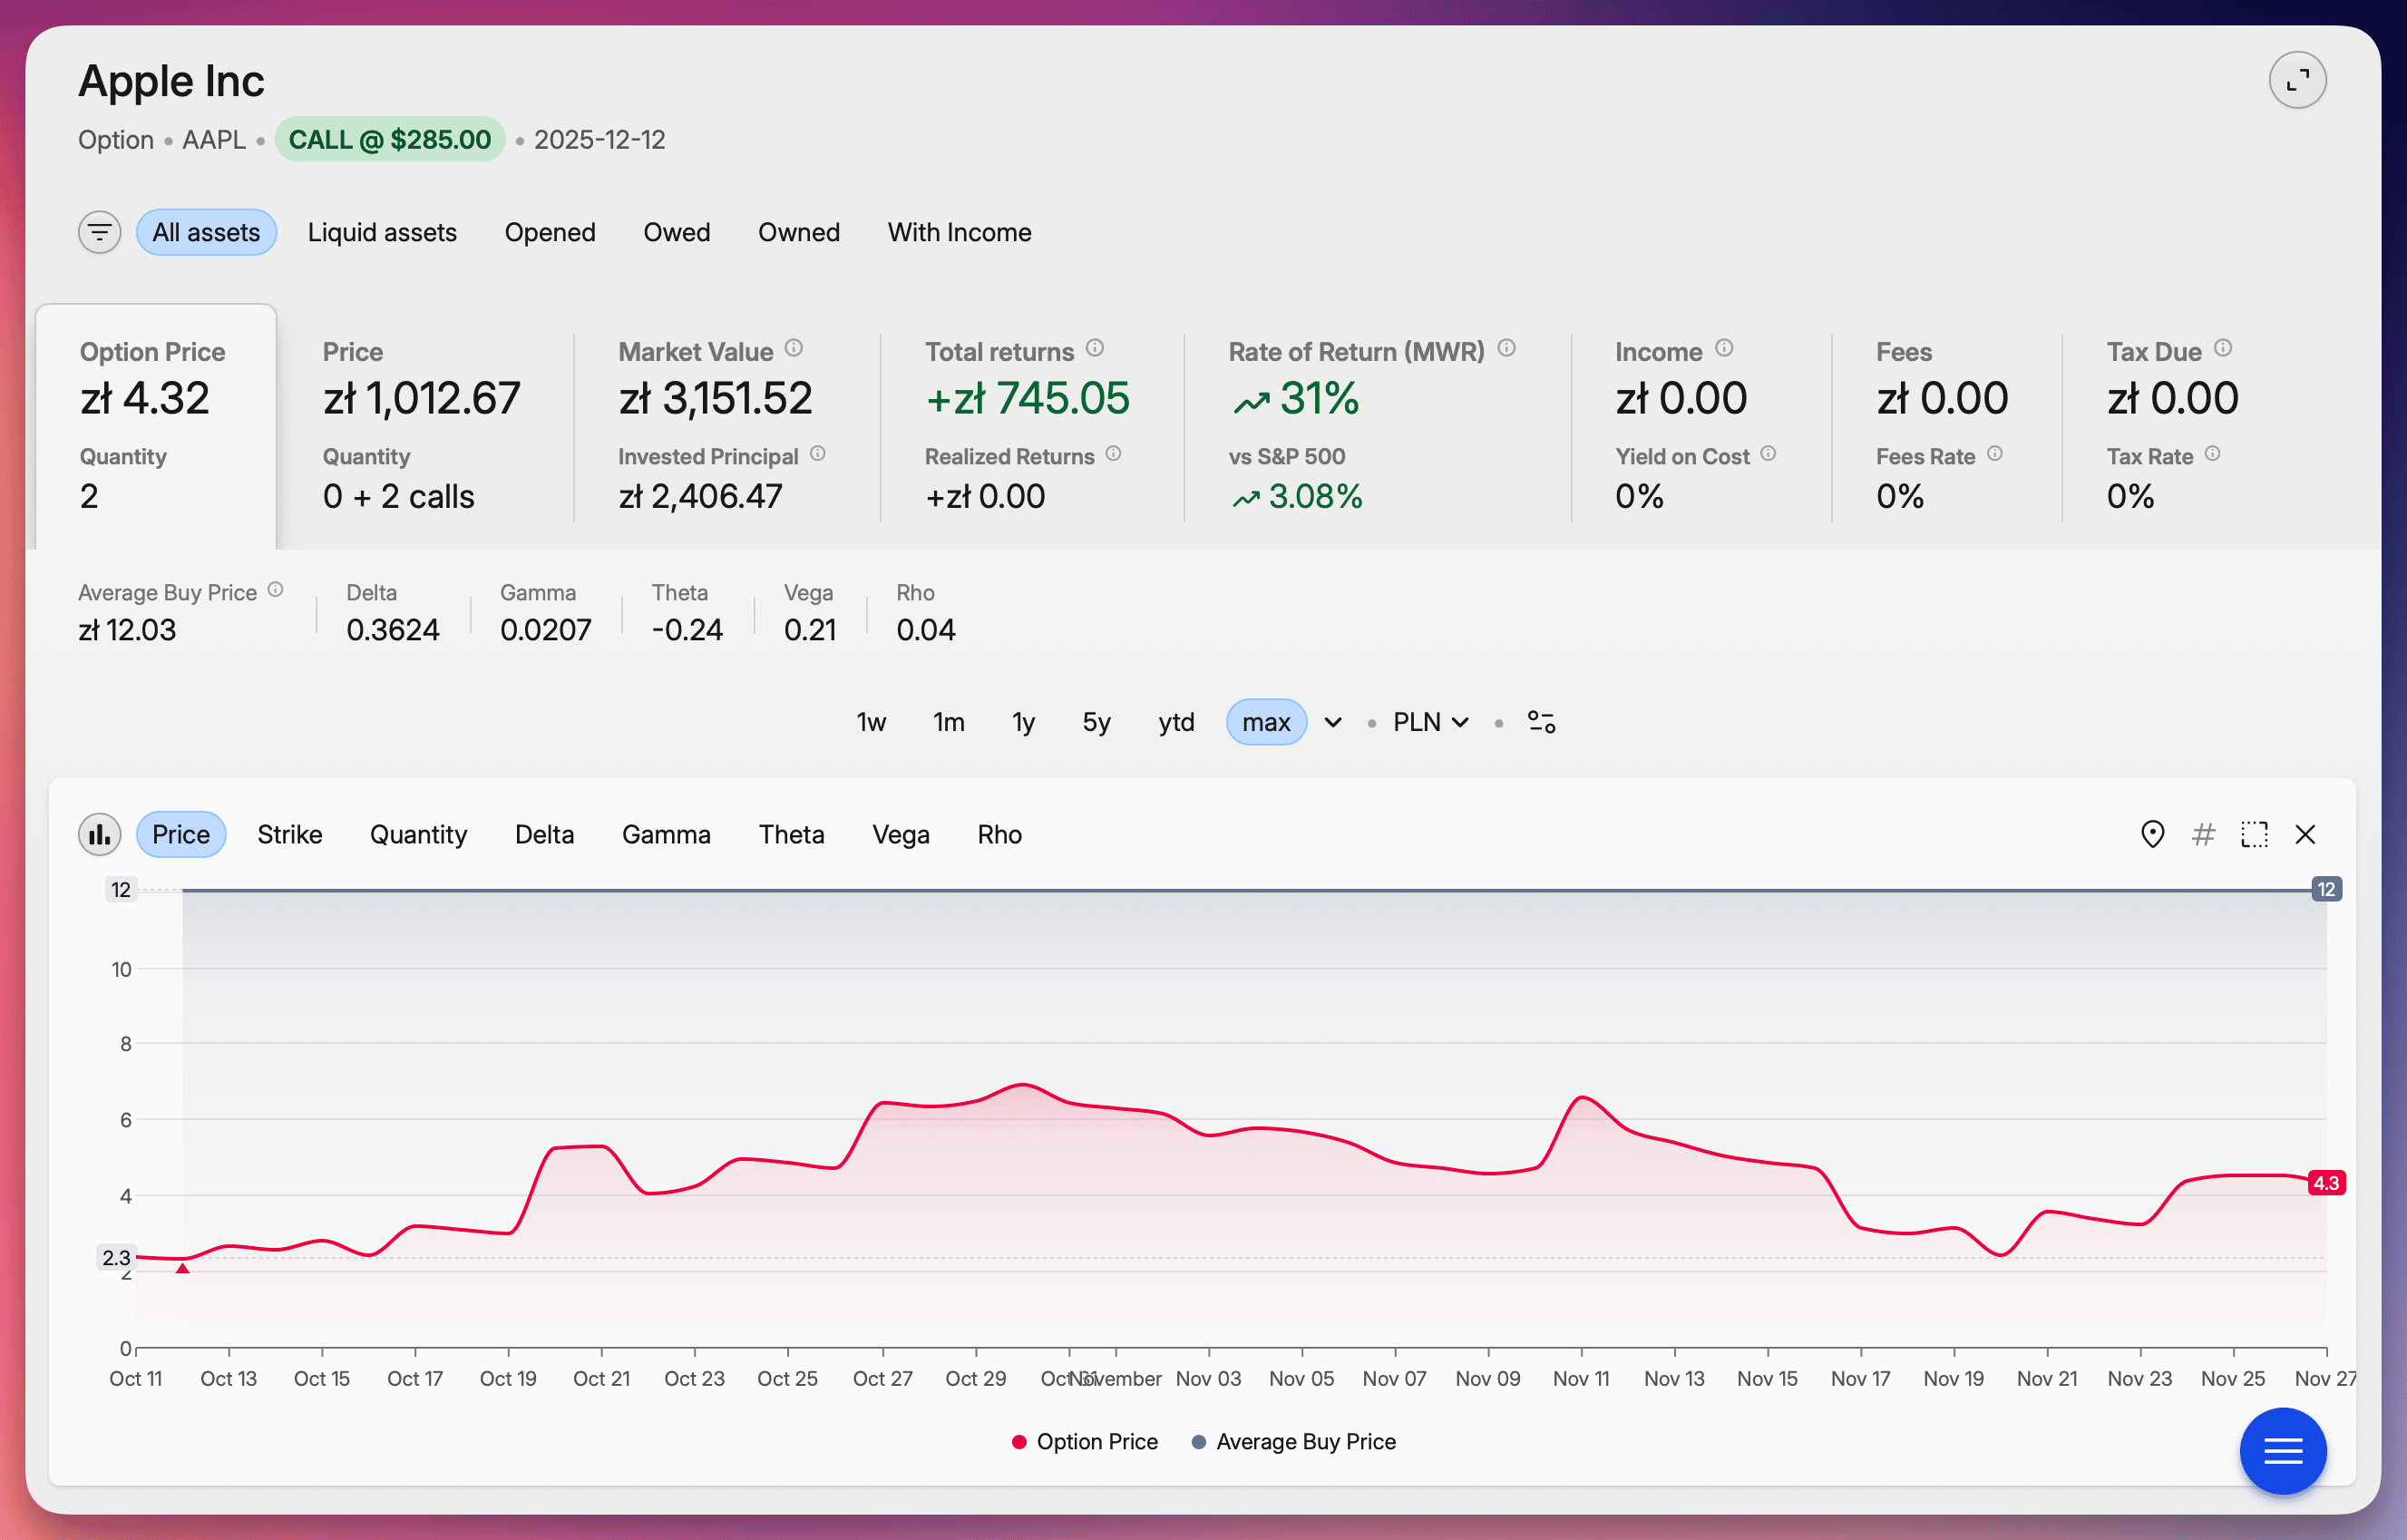
Individual option details
Click on any option to open its detail view. To the right of the standard asset price tab, you'll see the Option Price tab with:
- Historical option price chart
- Historical charts for all Greeks
- Comparison between strike price and the underlying asset's actual price
- Your position quantity over time
Tracking margin requirements
If you sell options or short stocks, monitoring margin is essential to avoid margin calls.
Open the Market value metrics panel to see the Margin requirement value. This shows the minimum asset value required in your portfolio to cover your obligations from sold options and shorted stocks.
The margin requirement is context-aware — when you filter your portfolio or open a specific account, it reflects the requirement for just that portion.
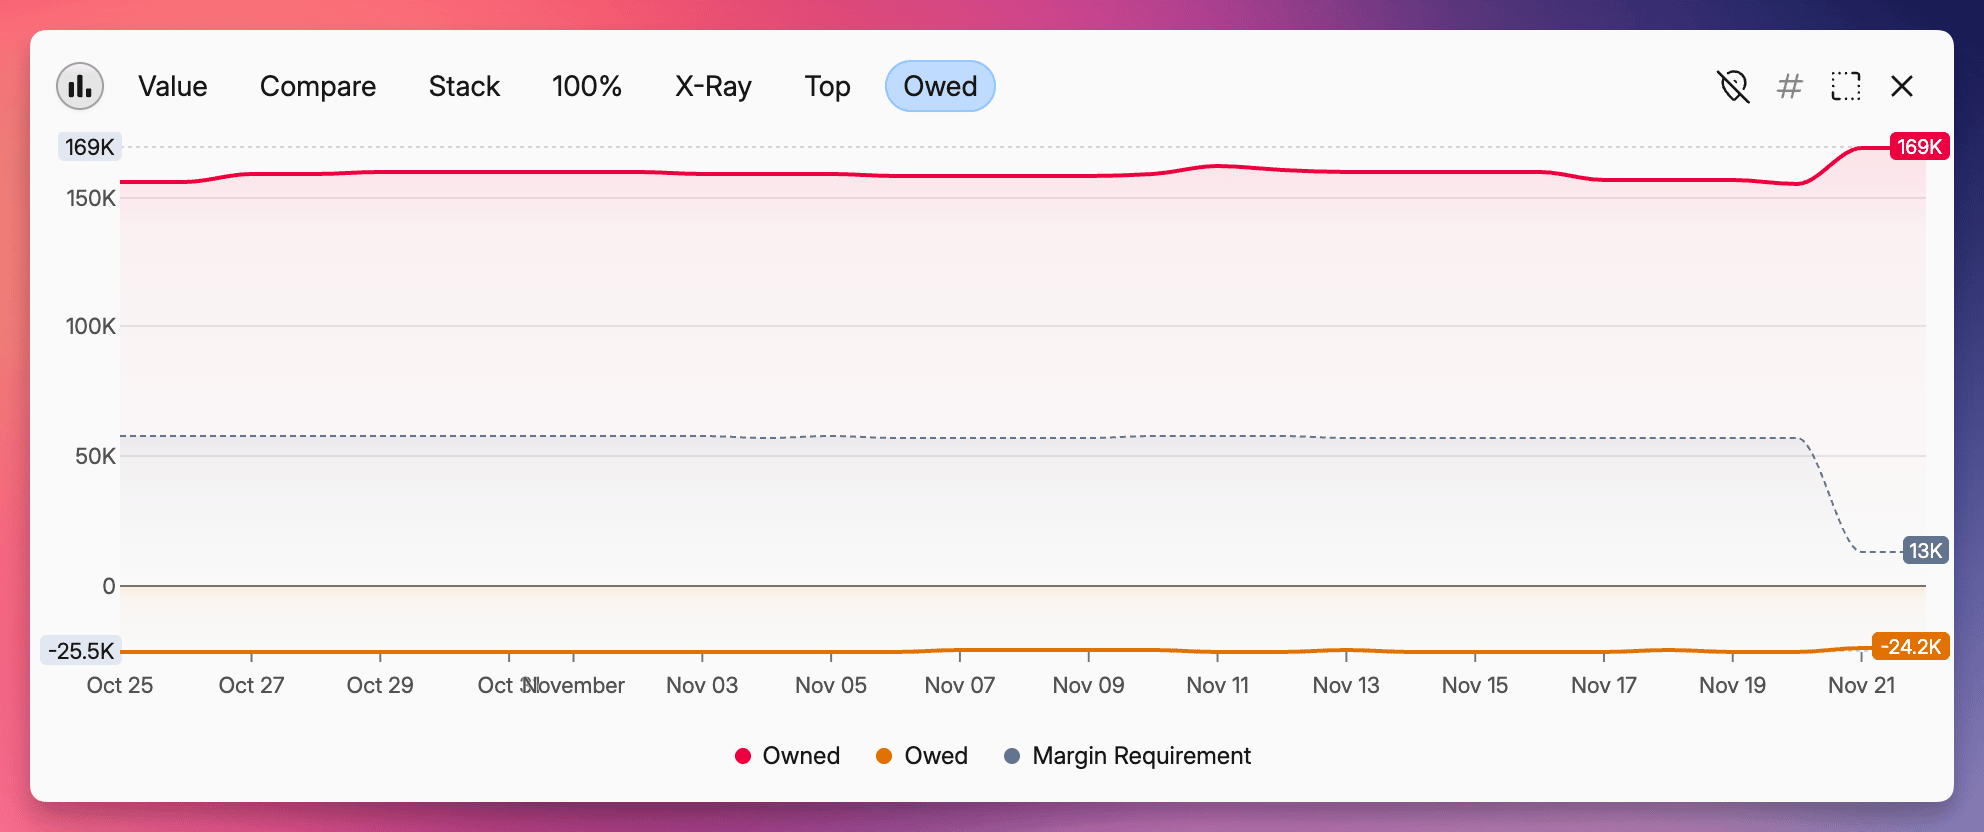
Using the Owed chart
The Owed chart provides a visual overview of your margin situation with three lines:
- Red line — value of assets you own
- Orange line — value of what you owe (sold options, short positions)
- Gray dotted line — margin requirement
The key is to keep your owned assets (red) well above the margin requirement (gray dotted line). If they get too close, you risk a margin call.
Configuring margin settings
You can customize margin requirement percentages for different position types in Settings → Advanced tracking:
- Sold puts
- Sold calls
- Shorted stocks
- Shorted crypto
For puts and calls, the requirement will be the percentage of the underlying asset value, not the option fair value.
How option prices are calculated
Capitally calculates option fair values using established pricing models rather than pulling live market prices:
- Black-Scholes-Merton for European-style options
- Barone-Adesi-Whaley for American-style options
This approach lets you track options on any underlying asset, even if the options aren't traded on a public exchange.
Pricing inputs
The models use several variables:
- Volatility — calculated from one year of historical price data
- Dividend yield — average yield over the past five years
- Risk-free rate — current three-month US Treasury rate by default
Customizing the risk-free rate
If you need a different risk-free rate, you can enter a preferred constant value in Settings → Advanced tracking.
Common questions
Can I track options on custom or illiquid assets?
Yes. Because Capitally models prices rather than pulling them from exchanges, you can create a custom asset, attach options to it, and have Capitally compute fair value and Greeks based on its price history. This works even for options not listed on any exchange.
Why doesn't my option price match my broker's price exactly?
Capitally uses theoretical models with historical volatility, long-term dividend yield averages, and a configurable risk-free rate. Market prices may differ due to intraday volatility changes, supply/demand imbalances, or bid-ask spreads. The goal is consistent portfolio-level analytics rather than tick-by-tick replication of broker quotes.