Whether you're an LP in a venture capital fund, a buyout fund, or any other private equity vehicle, Capitally lets you track your full PE lifecycle — from capital commitments through distributions and exit — with dedicated PE metrics like TVPI, DPI, and RVPI.
Private Equity tracking is available on Captain and Founders plans.
Setting up a Private Equity fund
To start tracking a PE investment, add it as a Private Equity custom asset:
- Click Add
- Choose create a custom asset
- Choose the Private Equity asset type
- Enter the fund name, currency, and any other details
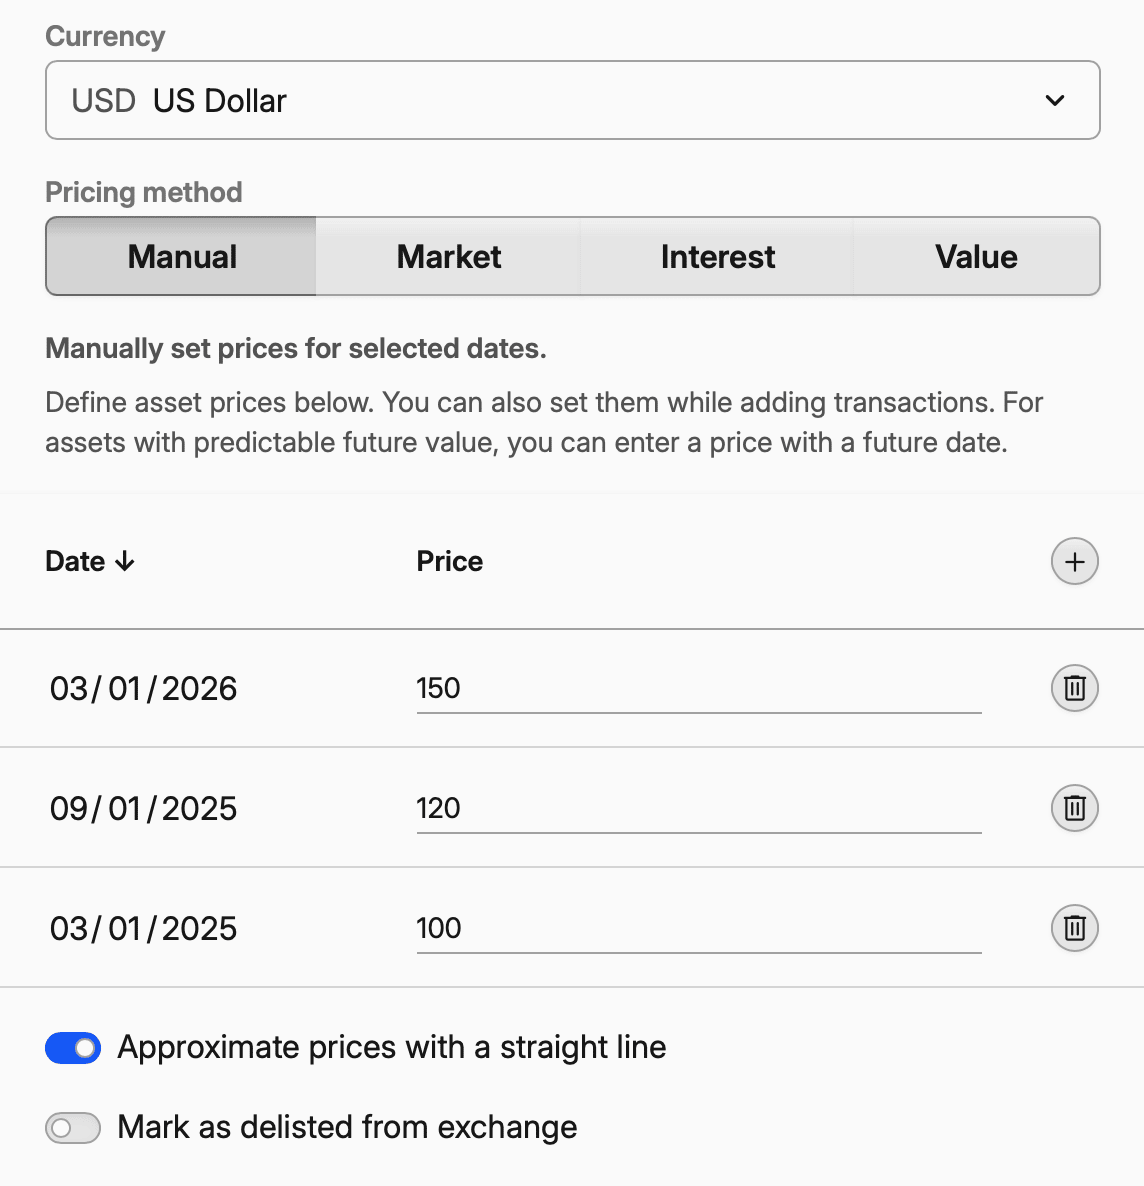
- Leave Pricing method in Prices tab as Manual
Tip
Private Equity assets use real unit/price tracking. You'll track your ownership in units and the fund's NAV as the price per unit — just like stocks, but with manual price updates.
Recording a Capital Commitment
A capital commitment is the total amount you've pledged to invest in a fund. It's not a cash flow — it's your binding obligation to provide capital when the fund calls for it.
To record your commitment:
- Click Add
- Choose your PE fund
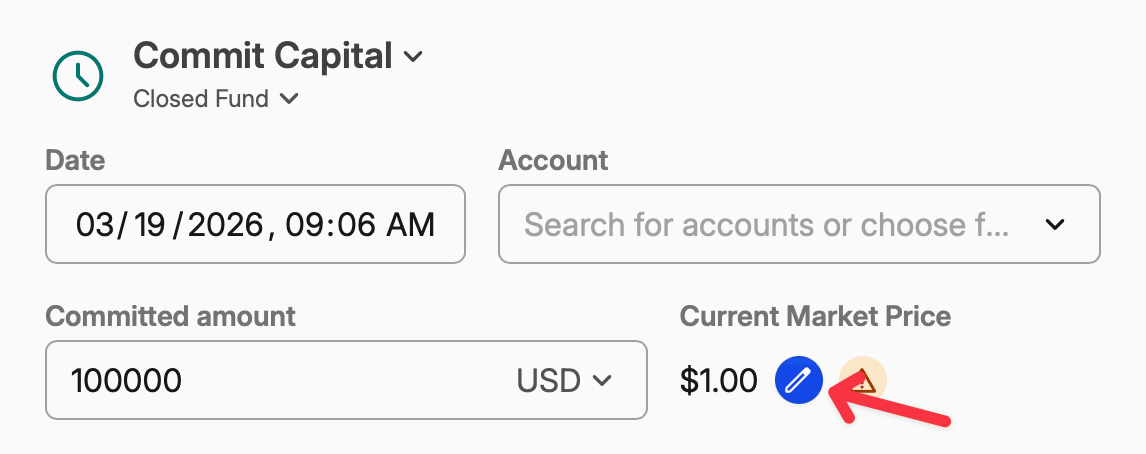
- Choose Capital Commitment transaction type
- Enter the Committed amount and the date
- If it's the first transaction on that asset, set the Current Market Price to a current price per share
How commitments work
Each Capital Commitment transaction sets the total commitment — it doesn't add to previous entries. To increase your commitment (e.g., at a subsequent fund closing), add a new Capital Commitment with the new, higher total. To reduce it, enter the lower amount.
Recording Capital Calls
When the fund's general partner (GP) requests you to transfer part of your committed capital, that's a capital call. In Capitally, capital calls are recorded as Buy transactions — but they appear labeled as Capital Call on PE assets.
- Click Add
- Choose your PE fund
- Choose Capital Call transaction type
- Enter the date, Quantity of shares and Price per share
Unfunded commitment
Capitally automatically updates your paid-in capital and reduces your unfunded commitment
Recording Distributions
Distributions are cash flows back from the fund to you. In Capitally, distributions are recorded via Dividends — but they appear labeled as Distribution on PE assets.
Return of Capital Distributions
When the fund returns your own invested capital (e.g., from an exit of a portfolio company), that's a Return of Capital. It's not income — it reduces your cost basis while keeping your units unchanged.
To record a Return of Capital distribution:
- Click Add
- Choose your PE fund
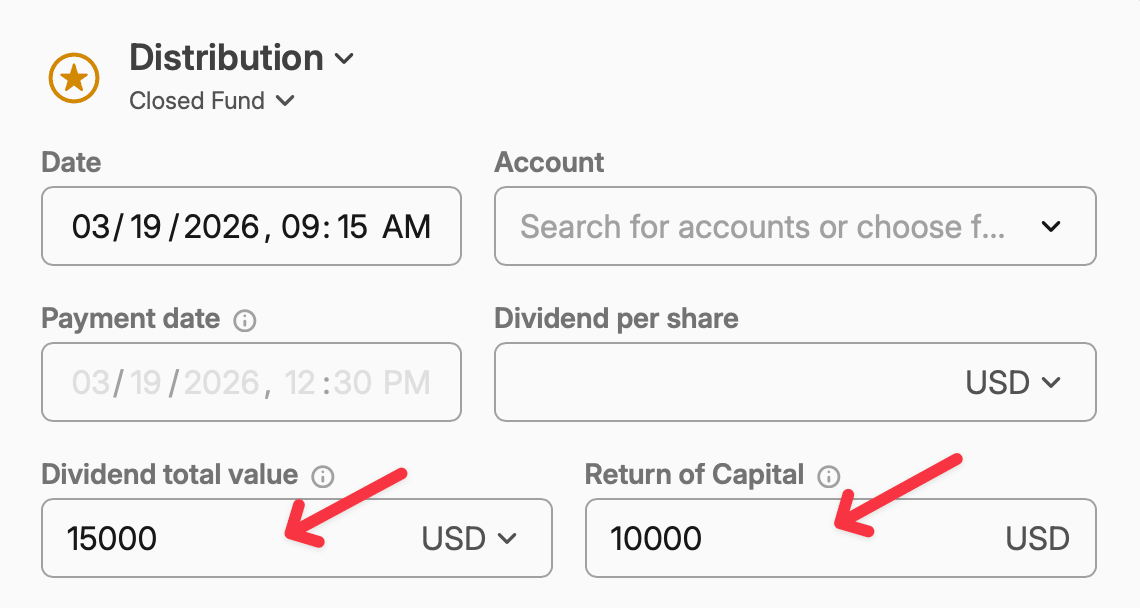
- Choose Distribution transaction type
- Enter the amount in the Return of Capital field
If the distribution is entirely Return of Capital, you can leave the main Dividend total value field set to 0 and only fill in the Return of Capital amount. For mixed distributions (part profit, part RoC), fill in both fields. Just remember that in such case, Dividend total value should include the Return of Capital.
 10000 Return of Capital + 5000 Income
Capitally automatically:
- Reduces your cost basis proportionally across all lots
- Keeps your unit count unchanged
- If Dividend total value exceeds the Return of Capital, the excess is treated as realized income
- If Return of Capital exceeds your total cost basis, the excess is treated as realized income
Learn more
Return of Capital works the same way as for stocks, REITs, and other assets. See Recording Corporate Events — Return of Capital Distribution for more details.
Profit Distributions
When the fund distributes profits (gains above your cost basis), record a Distribution with the amount in the main Dividend total value field. These show up as realized income in your portfolio.
Updating Fund Valuation (NAV)
PE funds typically report their Net Asset Value quarterly. In Capitally, you update the NAV by setting a new price per unit for your PE asset.
- Edit your PE asset and go to Prices tab
- Add a new price entry with the date and the fund's latest NAV per unit
Note on prices
Most PE funds don't have automated price feeds. You'll update prices manually based on your quarterly fund statements — similar to how you'd track any private or illiquid asset.
PE Performance Metrics
When you open a Private Equity asset in the portfolio (or open Private Equity from the Types tab), you'll see an additional metrics tab with PE-specific performance indicators, charts and columns.
Key Metrics
Metric | Formula | What It Tells You |
|---|---|---|
TVPI (Total Value to Paid-In) | (Distributions + Current NAV) / Paid-In | Total return multiple. A TVPI of 1.5x means $1.50 of total value for every $1.00 invested. |
DPI (Distributions to Paid-In) | Total Distributions / Paid-In | Cash-on-cash return (realized). How much cash you've actually received back. |
RVPI (Residual Value to Paid-In) | Current NAV / Paid-In | Unrealized value still in the fund, relative to what you've put in. |
Committed Capital | Set via Capital Commitment | Total amount pledged to the fund. |
Paid-In Capital | Sum of all Capital Calls | Total cash actually transferred to the fund. |
Unfunded Commitment | Committed − Paid-In | How much you may still be called to invest. |
Understanding multiples
TVPI = DPI + RVPI. A TVPI above 1.0x means positive returns. DPI shows what's already in your pocket; RVPI shows what's still invested in the fund. As the fund matures and distributes proceeds, DPI rises and RVPI falls.
Full Lifecycle Example
Here's how a typical PE fund investment looks over its lifetime:
Step | Year | Transaction | Details | Cumulative |
|---|---|---|---|---|
1 | — | Capital Commitment | Set commitment to $1,000,000 | Committed: $1M |
2 | 1 | Capital Call | 5,000 units @ $100 = $500,000 | Paid-in: $500K, Unfunded: $500K |
3 | 2 | Capital Call | 3,000 units @ $100 = $300,000 | Paid-in: $800K, Unfunded: $200K |
4 | 2 Q4 | NAV Update | Price → $120/unit | Value: $960K, Unrealized: +$160K |
5 | 3 | Capital Call | 2,000 units @ $100 = $200,000 | Paid-in: $1M, Unfunded: $0 |
6 | 4 | Distribution (ROC) | $150,000 return of capital | Cost basis → $850K |
7 | 5 | NAV Update | Price → $140/unit | Value: $1.4M |
8 | 6 | Distribution (Profit) | $200,000 income | Total distributed: $350K |
9 | 10 | Exit (Sell) | 10,000 units @ $180 = $1,800,000 | Total received: $2.15M |
Final result: $1M invested → $2.15M total distributions → TVPI: 2.15x